Global analysis of aviation CO2 shows Heathrow far above any other global airport and UK 9th highest aviation CO2 per capita
Dave Southgate is an Australian aviation expert, with many years of experience of working on the measurement of aviation emissions. He has produced a new e-book, on the carbon footprint of global scheduled domestic and international passenger flights in 2012. It contains detailed information covering some 85% of global aviation emissions, and gives some interesting insights. For the UK, domestic flights are a very much smaller proportion than in larger countries. However, Heathrow remains by a very large margin the airport with the largest carbon emissions of any worldwide, about 16,584 thousand tonnes of CO2 per year, with Los Angeles in second place with some 11,866 thousand tonnes. The book also shows the UK ranks 9th in the world for carbon emissions per capita from aviation, with (of European countries) Switzerland in 6th place, the Netherlands in 8th place, far above Germany (12th) and France (13th), with the highest per capita aviation emissions being Qatar, UAE, Singapore and Hong Kong, Australia and USA. By total emissions per airline, Lufthansa and British Airways are almost the same, ranked 5th and 6th, with Air France ranked 8th and Ryanair ranked 20th.
.
Tweet
United States’ aviation carbon footprint in 2012 dwarfs that of other countries, finds new global analysis
by Dave Southgate (in GreenAir online)
Thu 12 Sept 2013
The carbon footprint from global scheduled domestic flights was around 39% of emissions from all scheduled operations in 2012.
Combined with international emissions, the United States’ aviation carbon footprint dwarfs that of other countries, being almost three times the size of the country – China – with the second largest footprint (Figures 1 and 2 below). Although 39/61 domestic/international is the average global split between domestic and international emissions from scheduled flights, US domestic emissions are around double those from international operations, whereas in China they are three times higher.
These stats can be found in a comprehensive new study by aviation carbon footprint expert Dave Southgate, the latest in a trilogy of national and global analysis he has undertaken. Although data and calculation tools are readily available, Southgate says he has found a surprising lack of consolidated aviation carbon emissions reporting at the country level.
Latest figures from IATA show total global carbon emissions from aviation were around 689 million tonnes in 2012.
In his e-book, ‘Carbon footprint of global scheduled domestic passenger flights 2012’, Southgate’s analysis covers emissions from domestic as well as international scheduled flights of around 584 million tonnes in 2012, about 85% of the aviation sector’s total output.
“While the carbon footprint of domestic aviation is not of direct interest in the discussions currently taking place within ICAO on the future management of international aviation’s carbon footprint, it is not unrelated,” he writes. “Many of the initiatives to reduce the carbon footprint of aviation capture both domestic and international aviation – for example more efficient aircraft and improvements in the efficiency of ATM and airports – and many government officials involved in the discussions have responsibilities for both domestic and international aviation.”
His 196-page book, which can be freely downloaded, breaks down scheduled domestic aviation emissions by country, airline, airport and aircraft type, and adds comparisons with scheduled international flights to provide a global overview.
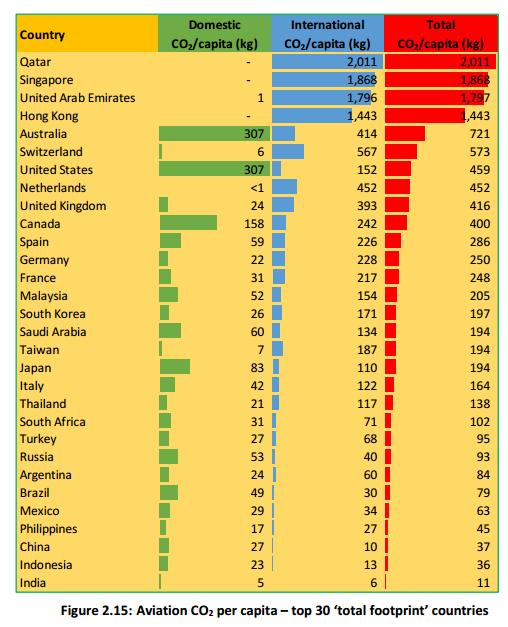
Southgate has also provided a ‘league table’ of the top 30 country total carbon emissions on a per capita basis by using country population data generated by the United Nations. Qatar, Singapore, United Arab Emirates and Hong Kong – small but prosperous nations with major airport hubs – far outstripped other countries. Australia and Switzerland then follow behind, just ahead of the United States. Although China is the second biggest emitter of carbon from aviation activities, it ranks 28th on the list. [The UK ranks 9th on the list, with Switzerland 6th and the Netherlands 8th, as the top European emitters].
In a chapter on ‘Monetising carbon’, Southgate has converted CO2 values into monetary values and shown them as a carbon cost per passenger. If a carbon charge of $20/tonne had been in place for all global scheduled domestic passenger aircraft departures in 2012, approximately $4.5 billion would have been raised, he calculates. On average this would have equated to a carbon charge of around $2.30 per passenger.
Countries with large land areas and widely spaced major economic centres would, not surprisingly, have resulted in higher charges. In 2012, Russia would have had the highest average cost per passenger ($3.80) and South Korea the lowest ($1.20) of the top 30 countries ranked by domestic footprint. For a passenger in the United States, the cost would have been $2.90 and in China it would have worked out at $2.40.
In a ranking of airline scheduled domestic operations worldwide, the top five airlines – Delta, United, Southwest, American and US Airways – make up around 35% of the global domestic footprint, while the top 10 contribute close to 50% of that footprint (Figure 3). All but one (All Nippon) of the top 10 carriers are Chinese or American.
Adding the domestic and international operations together shows that while the top three airlines – United, Delta and American – have significant domestic and international footprints, many of the major international airlines in the world have no, or very small, domestic footprints (Figure 4). United and Delta would occupy the third and fourth positions in the country hierarchy if they were countries. [ie. the carbon emissions of these two airlines are greater than all the aviation emissions of all countries, other than the USA and China].
The book also ranks the top 30 airports in the world by the carbon footprint of departing domestic aircraft and compares domestic and international footprints. Unsurprisingly, 22 of the top 30 domestic airports are in the United States, with six in China and one each in Japan and Indonesia. Atlanta has the highest domestic carbon footprint followed by Los Angeles (Figure 5). These two airports have far higher footprints than the next three: Beijing, Dallas-Fort Worth and Chicago.
Combining domestic and international airport operations, a different and globally diverse picture emerges with London Heathrow having the highest carbon footprint in the world, followed by Los Angeles, Dubai, New York, Frankfurt and Hong Kong (Figure 6).
Southgate has based his calculations on aircraft operations data supplied by Innovata and has used a freely available software tool, TNIP Carbon Counter, which is a great circle carbon counting application developed by the Australian Government Department of Infrastructure and Transport. The software contains all the information that is required to compute the weight of CO2 generated by a flight between any city-pair, he says. The fuel burn algorithms are the same as those contained in the ICAO Carbon Calculator. The counter also applies the great circle distance adjustment factors that are used in the ICAO calculator.
Southgate is a retired Australian Government self-styled ‘environmental bureaucrat’ and was Australia’s representative on ICAO’s Committee on Aviation Environmental Protection (CAEP) between 2004 and 2012, and a member of the CAEP group that developed ICAO’s calculator.
Carbon footprinting, he says, underpins the management of aviation’s contribution to climate change. “There is likely to be little confidence in any internationally agreed climate change management programme if its CO2 outcomes cannot be independently tracked and validated.
At the present time, the confidence that can be placed in the validation of global aviation’s carbon footprint is weakened due to a number of issues. There are no published consolidated reports, derived from a common base of computation, which provide verified carbon footprint information for the global aviation network. There are a number of ‘official’ published sources of fuel use and/or CO2 generation for aviation, both international and domestic, but they are not consistent.”
In his book, Southgate acknowledges there are ‘data gaps’ in his analysis that constitute about 10-15% of the total global domestic aviation carbon footprint. “Ideally, it would be desirable to present a complete picture of the carbon footprint of all global aircraft operations but much important data is not readily available to members of the public,” he writes. “To present a complete global carbon footprint picture of domestic aviation data would need to be available on other sub-sectors contributing to the carbon footprint such as airfreight, non-scheduled aviation, business aviation and general aviation.”
Despite this, Southgate has managed to accomplish his aim of presenting a comprehensible picture of the composition of airline, airport and country footprints in order to raise awareness, aid understanding and to generate thinking on new approaches to managing aviation’s carbon footprint.
Although ICAO’s remit covers only international and not domestic civil aviation emissions, in its submission to the upcoming 38th ICAO Assembly later this month concerning the establishment of a global market-based measure, the aviation industry calls on ICAO to develop an ICAO standard for monitoring, reporting and verifying emissions from aviation.
The 38th Assembly climate change resolution is likely to request work be undertaken at ICAO on methodologies and a mechanism to measure, monitor and verify global emissions from international aviation, as well as annual reporting of traffic, fuel consumption and emissions data.
Southgate says that if a carbon management regime for aviation involves a financial liability, there will be a need for detailed, formal verifiable tracking. However, such verification systems are by necessity complex and have significant time lags between CO2 emission and reporting, he cautions, and they are also non-transparent except at an aggregate level due to airline commercial confidentiality issues.
“Verification systems solely based on non-transparent reporting are likely to generate mistrust and to ultimately be challenged,” warns Southgate. Footprint transparency could be introduced by running some form of parallel carbon footprint reporting/tracking regime based on great circle analysis, which would facilitate open and rapid third-party verification, he suggests. “In order for this to take place, key aviation bodies would need to play an active role.”
http://www.greenaironline.com/news.php?viewStory=1737
.
Link:
‘Carbon footprint of global scheduled domestic passenger flights 2012’ – David Southgate
Figure 1. Country Top 30 by global domestic/international/total scheduled passenger movements 2012:

Figure 2. Country Top 30 by global domestic scheduled passenger movements 2012:

Figure 3. Airline Top 30 by global domestic scheduled passenger movements 2012:

Figure 4. Airline Top 30 by global domestic/international/total scheduled passenger movements 2012:

Figure 5. Airport Top 30 by global domestic scheduled passenger movements 2012:

Figure 6. Airport Top 30 by global domestic/international/total scheduled passenger movements 2012:

.