IATA air freight data over the past year month by month – slowing very small growth
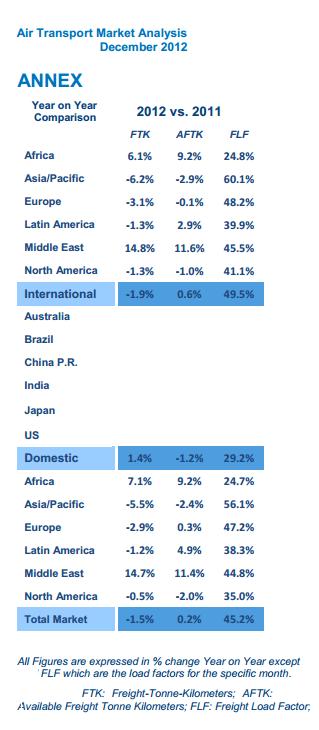
IATA monthly data show global air freight is only rising very slowly indeed, with falls in some months. For instance, measuring FTK (Freight Tonne Kilometres) the increase was +0.5% in September 2013; + 3.5% in August; + 1.2% in July; + 1.2% in June 2013; + 0.8% in May 2013; + 1.4% in April 2013; – 2.3% in March 2013; – 6.2% in Feb 2013 ; + 5.0% in Jan 2013; – 0.3% in Dec 2013; + 1.6% in Nov 2012; and -.3.5% in Oct 2012. For all of 2012, the amount of freight was down – 1.5% compared to 2011. And in 2011 the total number of freight kilometres was itself down by – 0.7% compared to 2010. At present, the total freight traffic market shares by region of carriers in terms of FTK are: Asia-Pacific 38.8%, Europe 23.9%, North America 20.8%, Middle East 12.0%, Latin America 3.1%, Africa 1.4%. In 2012 the only regions that saw a growth in air freight were Africa and the Middle East. All other regions saw a decline; this was – 2.9% in Europe. In 2011 there were approximately 29.7 millions tonnes air freighted.
.
Tweet
Data taken from IATA press releases at http://www.iata.org/pressroom/pr/Pages/index.aspx
Freight Tonne Kilometre growth (FTK growth) month by month:
Sept 2013 + 0.5%
Aug 2013 + 3.6%
July 2013 + 1.2%
June 2013 + 1.2%
May 2013 + 0.8%
April 2013 + 1.4%
March 2013 – 2.3%
Feb 2013 – 6.2%
Jan 2013 + 5.0%
Dec 2012 – 0.3%
Nov 2012 + 1.6%
Oct 2012 – 3.5%
for details see IATA figures for 2013
.
In 2012 globally the number of freight tonne kilometers (FTK) fell by 1.5% compared to 2011
http://www.iata.org/pressroom/pr/Pages/2013-01-31-01.aspx

.
.
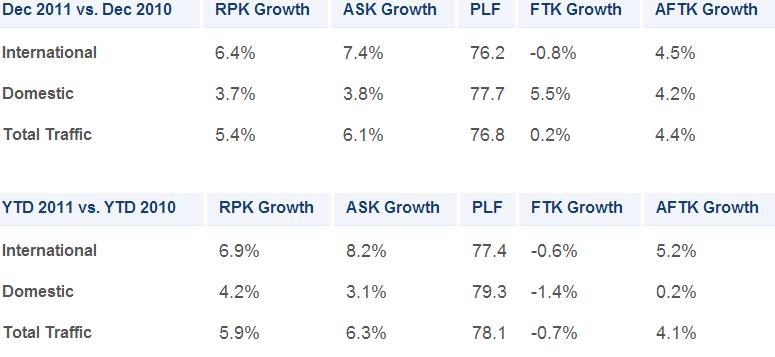
In 2011, globally the number of Freight Tonne Kilometres (FTK) fell by 0.7% compared to 2010
.
30 October 2013 ( IATA)
Global Cargo Growth Stabilizes – Regional Variances Remain
Geneva – The International Air Transport Association (IATA) released figures showing cargo growth stabilizing in September following recent months of slow but steady growth. Freight Tonne Kilometers (FTK) grew by 0.5% year-on-year. While this is slower that the 3.4% growth recorded for August, overall air cargo volumes are at a 25-month high, and steady increases in the size of the market since April have been supported by improvements in business conditions. The slow-but-steady global growth picture is colored by significant regional variation. Asia-Pacific airlines experienced a 3.1% fall in cargo activity compared to last September whereas carriers in the Middle East reported 9.9% growth.
“The story behind September’s performance is regional. The leveling-off of global volumes was a result of the growth rate in Europe and the Middle East moderating after recent acceleration, while Asia-Pacific airlines saw a deepening of the market weakness,” said Tony Tyler, IATA’s Director General and CEO.
“At a global level, the September results are aligned with our expectations for an improvement towards the end of the year. All indicators still point to strengthening business confidence as we approach the final quarter. That’s cause for cautious optimism. But the persistent cargo weakness when compared to the strength of passenger markets is a signal for the industry to work at improving its value proposition with programs such as e-freight,” Tyler said.
| Sep 2013 vs. Sep 2012 | FTK Growth | AFTK Growth | FLF |
|---|---|---|---|
| International | 0.5% | 3.4% | 48.2 |
| Domestic | 0.5% | 2.9% | 32.4 |
| Total Market | 0.5% | 3.3% | 45.1 |
| YTD 2013 vs. YTD 2012 | FTK Growth | AFTK Growth | FLF |
|---|---|---|---|
| International | 0.3% | 1.9% | 48.3 |
| Domestic | 1.9% | 2.1% | 30.2 |
| Total Market | 0.5% | 1.9% | 44.7 |
Regional Analysis
September performance was heavily influenced by a moderation of freight growth in the Middle East, which has carried much of the rises of recent months. Asia-Pacific freight continued to decline, while Europe demonstrated a modest rise.
Asia-Pacific carriers continue to see weakness in air freight demand. FTKs fell 3.1% in September compared to a year ago, deepening the contraction so far this year to 2.1%. A positive sign for the future is that the pressure from regional economic weakness appears to be easing. In particular, China’s GDP growth has picked up slightly. Capacity grew 1.3% leaving load factors at 55.5%.
European carriers grew 1.4% in September year-on-year, down on August’s robust 3.4% rise. Benefiting from the improvement in the European economy, airlines in the region have carried about 30% of the rise in global volumes since the second quarter, and FTKs are now the highest they have been since mid-2011. The load factor, however, fell to 46.0% as capacity grew 2.6%.
North American airlines grew just 0.9% in September compared to a year ago, but this does buck the declining trend seen so far this year (-1.1%). Going forward, US prospects are uncertain; while business confidence started to improve in Q3, it remains below the average seen at the start of the year, and the impact of the US government shutdown in October is not yet clear.
Middle East carriers recorded strong growth in September, up 9.9%, but this is slightly below the average performance so far this year (12.3%). However, the underlying trends for the region are strong. Improving conditions in advanced economies should boost trade through the Gulf hubs, and trade volumes in the Middle East have shown solid momentum in recent months.
Latin American airlines continue to see solid growth in air freight volumes, expanding 3.9% year-on-year. The region has seen the strongest increase in trade this year (up 8% in August compared to the start of 2013) supporting the continued expansion in air freight demand. Latin American carriers were also the only region to increase load factors in September compared to a year ago, though the level overall is still below the global average.
African carriers’ FTKs fell 0.8% in September compared to a year ago, although for the year as a whole they are still in positive territory (1.1%). This is in line with recent performance: African freight growth has tailed off after a strong start to the year. Capacity rose by 11.2%, the second fastest of any region, which pushed their load factor down to just 26.3%, almost 20 percentage points lower than the global average (45.1%).
View September air freight results (pdf)
For more information, please contact:
Corporate Communications
Tel: +41 22 770 2967
Email: corpcomms@iata.org
Notes for Editors:
- IATA (International Air Transport Association) represents some 240 airlines comprising 84% of global air traffic.
- You can follow us at http://twitter.com/iata2press for news specially catered for the media.
- Explanation of measurement terms:
- FTK: Freight Tonne Kilometers measures actual freight traffic
- AFTK: Available Freight Tonne Kilometers measures available total freight capacity
- FLF: Freight Load Factor is % of AFTKs used
- IATA statistics cover international and domestic scheduled air traffic for IATA member and non-member airlines.
- All figures are provisional and represent total reporting at time of publication plus estimates for missing data. Historic figures may be revised.
- Total freight traffic market shares by region of carriers in terms of FTK are: Asia-Pacific 38.8%, Europe 23.9%, North America 20.8%, Middle East 12.0%, Latin America 3.1%, Africa 1.4%.
http://www.iata.org/pressroom/pr/Pages/2013-10-30-01.aspx
.
.
Global air freight tonnage growth or decline over recent years
Looking back at the annual figures that IATA produces each year, from its press releases, below are the figures for growth or decline in air freight over the past 8 years. [FTK is Freight Tonne Kilometres. AFTK is Available Freight Tonne Kilometres].
In 2011, air freight was down – 0.6% compared to 2010.
In 2010 if was up + 20.6% compared to 2009
In 2009 it was down – 10.1% compared to 2008
In 2008 it was down – 4% compared to 2007
In 2007 it was up + 4.3% compared to 2006
In 2006 it was up + 4.6% compared to 2005
In 2005 it was up + 3.2% compared to 2004
.
.
IATA hopes global air freight will increase by a 5-year compound annual growth rate of 3%
Date added: December 7, 2012
IATA has said it expects global air freight, which has not grown much this year and declined in some regions, to grow in future. It expects an increase in global air freight in 2012 of 1.4% compared to 2011, followed by an increase over the next 5 years which compounded is 3% , up to 3.7% growth in the year 2016. In 2011 there were approximately 29.7 millions tonnes air freighted. IATA expects there to be 34.5 million tonnes air freighted in 2016. However, they expect the growth of air freight in Europe over the next 5 years to be only 2.2%, which is the slowest growth of any region. IATA expects the UK to have 1.8 million tonnes of international air freight by 2016, compared to 2.3 million tonnes in 2011, according to CAA data . By 2016, the largest international freight markets will be the United States (7.7 million tonnes), Germany (4.2 mt, China (3.5 mt, Hong Kong (3.2 mt), Japan (2.9 mt, the United Arab Emirates (2.5 mt), the Republic of Korea (1.9 mt), the UK (1.8 mt), India (1.6 mt) and the Netherlands (1.6 mt).
Click here to view full story…
.
http://www.iata.org/whatwedo/Documents/economics/MIS_Note_Dec12.pdf
