CAA air passenger survey 2012 confirms low % of passengers on business, and high % of AB and C1 flying
The CAA Air Passenger Survey for 2012 has been published. It covered Birmingham, Bristol, Cardiff, East Midlands, Exeter, Gatwick, Heathrow, London City, Luton, Manchester and Stansted Airports. (Each year it covers a slightly different selection). Over 210,000 departing passengers were questioned. Some of the interesting findings from the survey were: Heathrow had 37% connecting passengers; London City airport had the highest proportion on business, at 54% (down from 63% in 2010); Heathrow had 32.4% on business; Gatwick 17.5%; Manchester 23.9 %; Stansted 15%; Luton 16.1%; Birmingham 22.5%. The survey also looked at the socio-economic group of passengers. In the categories C2, D and E, Heathrow had 19.9%; London City airport 14.6%; Gatwick 26%; Stansted 29.3%; Manchester 43.4%; Luton 28.9%; Birmingham 33% and Bristol 35.3%. By contrast around 45% of the UK population are classed by polling organisations at C2,D+E. For the London airports, the AB group fly a disproportionate amount.
.
Tweet
CAA reveals London 2012 impact on UK airport passenger numbers
5 November 2013
Survey is at 2012 Passenger Survey
The UK Civil Aviation Authority (CAA) published the results of its 2012 passenger survey yesterday, revealing the impact of last year’s Olympic Games on passenger numbers at Britain’s airports.
The CAA carries out its annual passenger survey to improve its understanding of the people who use the UK’s airports. Despite overall passenger numbers between July and September in 2012 falling compared to the same period in 2011, the results published today show over 800,000 passengers passed through London’s airports for Olympic-related journeys during these months. 54% of these journeys were at Heathrow (above), with the next highest proportion at Gatwick (18%).
Unsurprisingly the majority (71%) of these Olympic journeys were for leisure with visitors heading to the UK to enjoy the London 2012 experience. However, almost a third (29%) of these journeys for business purposes – which would include many of the 10,000 athletes who attended the Games.
The 2012 survey questioned over 210,000 departing passengers at five London airports (City, Gatwick, Heathrow, Luton and Stansted) as well as Birmingham, Manchester, East Midlands, Bristol, Cardiff and Exeter).
Other key findings from the CAA’s 2012 Air Passenger Survey include:
• Heathrow is the only airport surveyed in 2012 where the majority of passengers were foreign residents (59%). By contrast, Exeter had the smallest proportion of foreign residents using the airport (9%).
• Heathrow had the highest proportion (37%) of connecting passengers using the airport, up by three percentage points from 2011. By comparison, Bristol, Cardiff and East Midlands airports all saw less than 1% of their passengers using the airport to change aircraft.
• London City had the largest proportion of passengers travelling for business (54%). However this represents a 9% drop since 2010 (when the airport was last surveyed) as a greater proportion of leisure passengers have used the airport. The next highest was Heathrow with 30%, whilst the airports with the highest proportion of leisure passengers were East Midlands 91%, and Bristol and Cardiff both with 86 per cent.
• Travellers from Heathrow took a higher proportion of trips (21%) lasting more than two weeks than anywhere else. In contrast, London City had the lowest proportion of the London airports at only 4%. Outside of London, the highest percentage of trips over two weeks was recorded at Manchester, with 13.4%. The lowest was at Cardiff at 5.2%.
Iain Osborne, group director of Regulatory Policy at the CAA, said: “Last year’s Olympics put London and the UK in the spotlight and today’s survey results show the impact the Games had on passenger numbers at our airports. Almost a million visitors flew into London for the Olympics, but overall passenger number s fell.
“The CAA passenger survey results also offer an invaluable insight into the people who use UK airports and why they do so. As such, they provide a vital resource for the aviation industry to use to ensure their services meet the changing needs of today’s air passengers.”
A summary of the Passenger Survey is available to download for free from the CAA website atwww.caa.co.uk/surveys .
http://www.adsadvance.co.uk/caa-reveals-london-2012-impact-on-uk-airport-passenger-numbers.html
.
From the CAA air passenger survey 2012
Proportion of business passengers
http://www.caa.co.uk/docs/81/2012CAAPaxSurveyReport.pdf
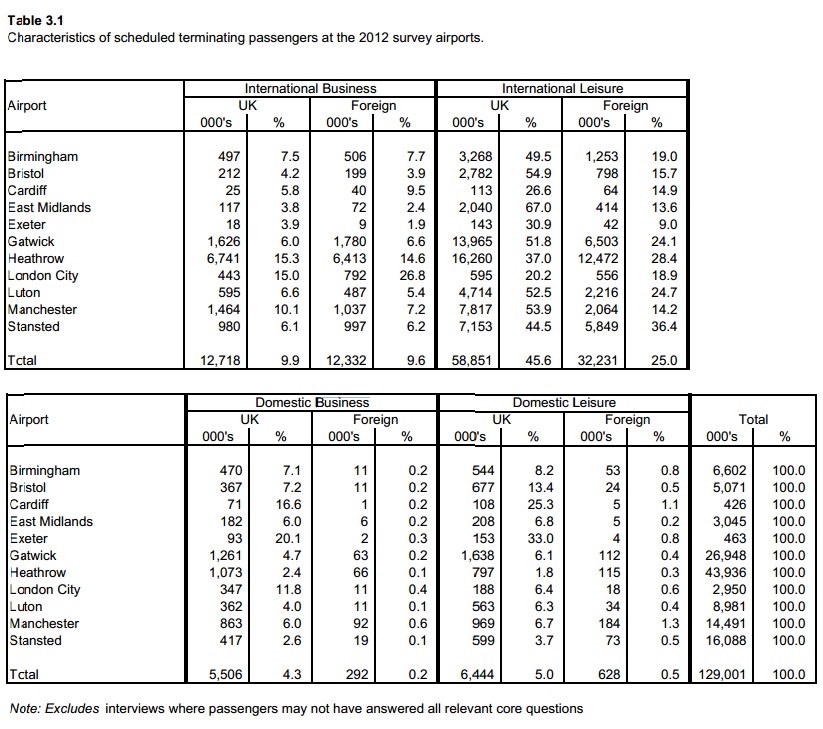
So putting these figures together, to get the totals of business passengers, this comes to 24% for all the airports in the CAA survey – table rearranged below to make this more clear.
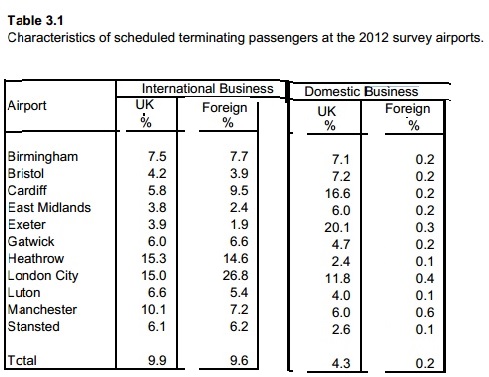
The total for all business passengers at the airports in the survey is 24% (of which 19.5% were on international business).
For Heathrow the total on business was 32.4% (19.9% international)
For Gatwick the total on business was 17.5% (12.6% international)
For London City Airport the total on business was 54% (41.8% international)
For Stansted the total on business was 15% (12.3% international)
For Manchester the total on business was 23.9% ( 17.3% international)
For Luton the total on business was 16.1% (12% international)
For Exeter the total on business was 26.2% (5.8% international)
For Birmingham the total on business was 22.5% (15.2% international)
For Bristol the total on business was 15.5% (8.1% international)
For Cardiff the total on business was 32.1% (15.3% international)
Socio-economic group of passengers surveyed
Below is the table showing socio-economic group of passengers, with the % in the three lowest groups added separately, by AirportWatch.
About 45% of the UK population were in the categories C2DE in 2008, with 29% in C1 and 27% in AB. link

The classifications are based on the occupation of the head of the household.
http://en.wikipedia.org/wiki/NRS_social_grade
| Grade | Social class | Chief income earner’s occupation |
|---|---|---|
| A | upper middle class | Higher managerial, administrative or professional |
| B | middle class | Intermediate managerial, administrative or professional |
| C1 | lower middle class | Supervisory or clerical and junior managerial, administrative or professional |
| C2 | skilled working class | Skilled manual workers |
| D | working class | Semi and unskilled manual workers |
| E | non working | Casual or lowest grade workers, pensioners, and others who depend on the welfare state for their income, this also includes students. |
About 45% of the UK population were in the categories C2DE in 2008, with 29% in C1 and 27% in AB. link
.
.