IATA – aviation CO2 emissions in 2018 approaching 1 billion tonnes
IATA has produced its annual report, with information about how the airline industry had done in the past two years, and how they think it will do in the coming year. Among many other details, it has the growth rates in RPK (Revenue Passenger Kilometres – the number of paying passengers flying a kilometre) for each region. Growth in RPK for 2017 was between about 7 – 10% for most regions; about 5 – 9% for 2018; and expected growth in 2019 is a little lower, about 3 – 6%. The amount of CO2 emitted by the airline sector was 860 million tonnes in 2017; 905 million tonnes in 2018; and expected to be 927 million tonnes in 2019. In fact, the AEF comments that in 2018, global aviation emissions – including an estimate for other airline and military emissions, based on EIA data, takes the total above 1,000 million tonnes of CO2 (ie. a billion). The fuel efficiency has not changed much. It was 23 litres of fuel per 100 atk in 2017; 22.8 in 2019; and it is expected to be 22.4 in 2019. As an investment, IATA says: “Airlines continue to create value for investors, but only just … This year we forecast the industry to generate a return on invested capital (ROIC) of 7.4%, which is only marginally above the cost of capital.” And “consumers will spend 1% of world GDP on air transport in 2019.”
.
Tweet
Economic Performance of the Airline Industry
Key Points
• World trade has weakened sharply, damaging cargo, but fiscal policy is providing stimulus so GDP growth remains supportive.
• Rising costs, particularly fuel, and the ability to recover those costs will remain a major challenge for the industry.
• Airlines continue to create value for investors, but only just, with ROIC falling to 7.4% in 2019, marginally above the cost of capital.
• Some airlines continue to generate free cash flow but not the industry in aggregate. Debt ratios begin to rise again this year.
• N American airlines perform best with a 5.5% net post-tax profit margin in 2019. Middle East the weakest with a 1.9% loss.
• Employment growth remains strong and jobs in the industry should exceed 2.9 million, and GVA per employee is over $98,600.
• Consumers benefit from lower real travel costs, more routes, and will spend 1% of world GDP on air transport in 2019.
• Economic development is stimulated by the doubling of city pairs and halving of air transport costs over the past 20 years.
• Governments gain from $129bn of tax in 2019 and from over 70 million ‘supply chain’ jobs.
….
A few extracts below:
Consumers will see a substantial increase in the value they derive from air transport in 2019. The average return fare (before surcharges and tax) of $317 in 2019 is forecast to be 61% lower than in 1998, after adjusting for inflation. The number of new destinations is forecast to rise further this year, with frequencies up too; both boosting consumer benefits. We expect 1% of world GDP to be spent on air transport in 2019, totaling $899 billion. RPK growth, which has been running well above trend, is forecast to slow further as economic growth weakens and fuel prices rise. But the major new weakness in the business environment is world trade, as a result of the trade disputes. GDP growth has slowed but by much less than trade, as domestic demand remains strong. The consequence has been a large downgrade in our forecast for cargo FTKs.
Carbon emissions
This year we forecast the airlines fuel bill will rise to $206 billion, which will represent 25% of average operating costs. Jet fuel prices have risen with oil prices and we base our forecast on an average jet price of $87.5/b next year, and $70/b for the Brent crude oil price. The earlier fall from the peaks of 2018 had been driven by an over-supply of crude oil, partly from shale oil production in the US. But sanctions on Iran’s oil exports and limited spare capacity in OPEC caused oil prices to rise back above $70/b. Crack spreads are also expected to rise under pressure from the IMO2020 regulation in shipping.
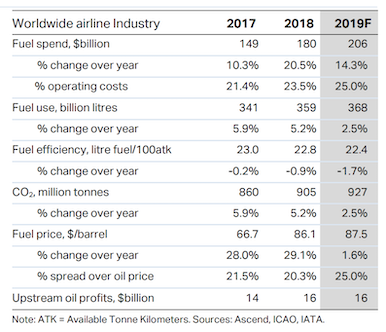
The carbon emissions have risen from860 million tonnes in 2017, to 905 million tonnes in 2018. The figure is expected to rise to 927 million in 2019.
The fuel efficiency has not changed much. It was 23 litres of fuel per 100 atk, and 22.8 in 2019. The number is expected to be 22.4 in 2019. (ATK = Available Tonne Kilometers.)
The AEF (Aviation Environment Federation) said:
“In 2018, global aviation emissions shot past the 1,000 MtCO2 mark for the very first time. @IATA reported this week that 2018 emissions from its members were 905 MtCO2. Adding an estimate for other airline and military emissions, based on @IEA data, takes the total above 1,000.”
.
Revenue passenger kilometres
Revenue passenger kilometres (RPK) is a measure of the volume of passengers carried by an airline. A revenue passenger-kilometre is flown when a revenue passenger is carried one kilometre.
Africa
RPK growth %
7% in 2017
6.1% in 2018
Expected in 2019 4.3%
Asia-Pacific
RPK growth %
10.9% in 2017
9.4% in 2018
Expected in 2019 6.3%
Middle East
RPK growth %
6.8% in 2017
5.0% in 2018
Expected 2% in 2019
Latin America
RPK growth %
7.4% in 2017
7.0% in 2018
Expected 6.2% in 2019
North America
RPK growth %
3.9% in 2017
5.3% in 2018
Expected 4.3% in 2019
Europe
RPK growth %
9.1% in 2017
7,5% in 2018
Expected 4.9% in 2019
see the full report at: