Arctic warms to highest level yet as researchers fear tipping points
Last year the Arctic, which is warming faster than anywhere else on Earth due to global climate change, experienced its warmest twelve months yet. According to NASA average Arctic temperatures in 2011 were 2.28 degrees C above those recorded from 1951-1980. As the Arctic warms, imperiling its biodiversity and indigenous people, researchers are increasingly concerned that the region will hit climatic tipping points that could severely impact the rest of the world. In 2011 the Arctic also experienced the lowest sea ice volume yet recorded, and the 2nd-lowest extent behind 2007. The older, thicker ice is declining faster than the rest, making for a more vulnerable perennial ice cover.
by Jeremy Hance
mongabay.com
February 13, 2012
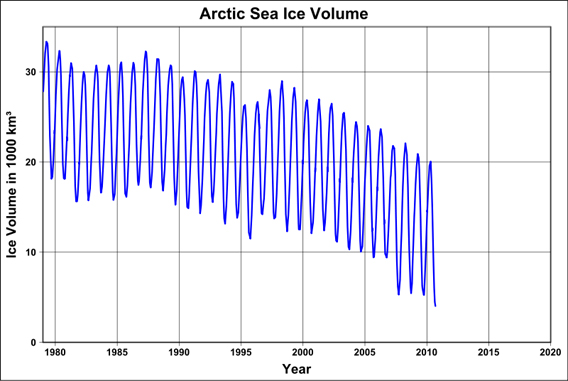
Scientists expect that the Arctic will be fully ice-free during summer sometime during this century. Graph by: Dominiklenne.
Last year the Arctic, which is warming faster than anywhere else on Earth due to global climate change, experienced its warmest twelve months yet.
According to recent data by NASA, average Arctic temperatures in 2011 were 2.28 degrees Celsius (4.1 degrees Fahrenheit) above those recorded from 1951-1980. As the Arctic warms, imperiling its biodiversity and indigenous people, researchers are increasingly concerned that the region will hit climatic tipping points that could severely impact the rest of the world. A recent commentary in Nature Climate Change highlighted a number of tipping points that keep scientists awake at night.
“If set in motion, [tipping points] can generate profound climate change which places the Arctic not at the periphery but at the core of the Earth system,” Professor Duarte, a climatologist with the University of Western Australia’s Ocean Institute and co-author other paper, said in a press release. “There is evidence that these forces are starting to be set in motion. This has major consequences for the future of human kind as climate change progresses.”
One of the tipping points is sea ice loss. The Arctic wasn’t just relatively hot last year—beating the previous record set in 2010 by 0.17 degrees Celsius (0.3 degrees Fahrenheit)—it also experienced the lowest sea ice volume yet recorded, and the second-lowest extent.
Sea ice is essential to many Arctic species, from polar bears to walrus, and narwhals to seals. In just over 30 years, sea ice volume has dropped precipitously, declining by 76% from 1979 (16,855 cubic kilometers) to 2011 (4,017 cubic kilometers). This loss of sea ice also leads to greater regional and global warming, as the Arctic’s sea reflects the sun’s light back into space, cooling not only the region but the world.
Sea ice loss may also be having a direct impact on weather in the mid-latitudes. In fact, recent research has suggested that, perhaps unintuitively, the extreme cold spell experienced by Europe this winter was linked to the sea ice decline in the Arctic.
Researchers argue that the Arctic Oscillation, which is partially responsible for weather conditions in the Northern Hemisphere in winter, has become unhinged by the sea ice decline, causing more extreme winters, such as Europe’s cold spell and the massive blizzards that hit the U.S. in 2009 and 2010.
But it’s not just sea ice loss that has produced stark concerns: greenhouse gases from thawing permafrost could be just as disastrous.
A study published in Nature late last year warned that greenhouse gas emissions due to permafrost thaw could equal the amount currently emitted by deforestation worldwide, a significantly larger estimate than has been put forward before. Moreover, since permafrost thaw emissions include methane, a more potent greenhouse gas than carbon, it could have an impact 2.5 times larger than deforestation overall.
“The larger estimate is due to the inclusion of processes missing from current models and new estimates of the amount of organic carbon stored deep in frozen soils,” co-author Benjamin Abbott, a University of Alaska Fairbanks graduate student, explained in a press release. “There’s more organic carbon in northern soils than there is in all living things combined; it’s kind of mind boggling.”
University of Florida researcher Edward Schuur says he doesn’t expect permafrost greenhouse gas emission to trump anthropogenic (human-caused) greenhouse gas emissions anytime soon, however they could become “an important amplifier of climate change.”
Further tipping points include an input of freshwater into the Atlantic Ocean from melting ice and glaciers, already increased by 30 percent, which Durate says “may affect the whole ocean current system and, as a result, the climate at a regional level.”
Governments have responded to warming in the Arctic with a resource race. Governments with Arctic territories plan to drastically expand oil and gas exploitation, utilize new shipping routes, and increase mining. The industrialization of the Arctic, according to Duarte, may only accelerate impacts on the fragile region and push tipping points.
“[Arctic tipping points] represents a test of our capacity as scientists, and as societies to respond to abrupt climate change,” Duarte said. “We need to stop debating the existence of tipping points in the Arctic and start managing the reality of dangerous climate change. We argue that tipping points do not have to be points of no return. Several tipping points, such as the loss of summer sea ice, may be reversible in principle—although hard in practice. However, should these changes involve extinction of key species—such as polar bears, walruses, ice-dependent seals and more than 1,000 species of ice algae—the changes could represent a point of no return.”
The solution, Durate says, is to cut the fossil fuel emissions that are causing climate change.
http://news.mongabay.com/2012/0213-hance_arctic_tippingpoints.html
NASA – Arctic Sea Ice Continues Decline, Hits 2nd-Lowest Level
Last month the extent of sea ice covering the Arctic Ocean declined to the second-lowest extent on record. Satellite data from NASA and the NASA-supported National Snow and Ice Data Center (NSIDC) at the University of Colorado in Boulder showed that the summertime sea ice cover narrowly avoided a new record low.
 NASA satellite data reveals how this year’s minimum sea ice extent, reached on Sept. 9 as depicted here, declined to a level far smaller than the 30-year average (in yellow) and opened up Northwest Passage shipping lanes (in red). (Credit: NASA Goddard’s Scientific Visualization Studio)
› Larger image | TIFF format (2.65 MB)
[and there are two video clips on the NASA website at http://www.nasa.gov/topics/earth/features/2011-ice-min.html ]
The Arctic ice cap grows each winter as the sun sets for several months and shrinks each summer as the sun rises higher in the northern sky. Each year the Arctic sea ice reaches its annual minimum extent in September. It hit a record low in 2007.
The near-record ice-melt followed higher-than-average summer temperatures, but without the unusual weather conditions that contributed to the extreme melt of 2007. “Atmospheric and oceanic conditions were not as conducive to ice loss this year, but the melt still neared 2007 levels,” said NSIDC scientist Walt Meier. “This probably reflects loss of multiyear ice in the Beaufort and Chukchi seas as well as other factors that are making the ice more vulnerable.”
Joey Comiso, senior scientist at NASA’s Goddard Space Flight Center in Greenbelt, Md., said the continued low minimum sea ice levels fits into the large-scale decline pattern that scientists have watched unfold over the past three decades.
“The sea ice is not only declining, the pace of the decline is becoming more drastic,” Comiso said. “The older, thicker ice is declining faster than the rest, making for a more vulnerable perennial ice cover.”
While the sea ice extent did not dip below the 2007 record, the sea ice area as measured by the microwave radiometer on NASA’s Aqua satellite did drop slightly lower than 2007 levels for about 10 days in early September, Comiso said. Sea ice “area” differs from extent in that it equals the actual surface area covered by ice, while extent includes any area where ice covers at least 15 percent of the ocean.
Arctic sea ice extent on Sept. 9, the lowest point this year, was 4.33 million square kilometers (1.67 million square miles). Averaged over the month of September, ice extent was 4.61 million square kilometers (1.78 million square miles). This places 2011 as the second lowest ice extent both for the daily minimum extent and the monthly average. Ice extent was 2.43 million square kilometers (938,000 square miles) below the 1979 to 2000 average.
This summer’s low ice extent continued the downward trend seen over the last 30 years, which scientists attribute largely to warming temperatures caused by climate change. Data show that Arctic sea ice has been declining both in extent and thickness. Since 1979, September Arctic sea ice extent has declined by 12 percent per decade.
“The oldest and thickest ice in the Arctic continues to decline, especially in the Beaufort Sea and the Canada Basin,” NSIDC scientist Julienne Stroeve said. “This appears to be an important driver for the low sea ice conditions over the past few summers.”
Climate models have suggested that the Arctic could lose almost all of its summer ice cover by 2100, but in recent years, ice extent has declined faster than the models predicted.
NASA monitors and studies changing sea ice conditions in both the Arctic and Antarctic with a variety of spaceborne and airborne research capabilities. This month NASA resumes Operation IceBridge, a multi-year series of flights over sea ice and ice sheets at both poles. This fall’s campaign will be based out of Punta Arenas, Chile, and make flights over Antarctica. NASA also continues work toward launching ICESat-2 in 2016, which will continue its predecessor’s crucial laser altimetry observations of ice cover from space.
For historical comparison:
Rising seas ‘to beat predictions’
(18.12.2007 BBC)
The world’s sea levels could rise twice as high this century as UN climate scientists
have previously predicted, according to a study in the journal, Nature Geoscience.
The IPPC proposes a maximum sea level rise of 81cm (32in) this century. Researchers
say the true maximum could be about twice that: 163cm (64 inches).
The results join other studies showing that current sea level projections may
be very conservative.
Sea level rise is a key effect of global climate change. There are two major
contributory effects: expansion of sea water as the oceans warm, and the melting
of ice over land.
In the latest study, researchers came up with their estimates by looking at the
so-called interglacial period, some 124,000 to 119,000 years ago, when Earth’s
climate was warmer than it is now due to a different configuration of the planet’s
orbit around the Sun. That was the last time sea levels reached up to 6m (20ft)
above where they are now.
The study found an average sea level rise of 1.6m (64in) each century during
the interglacial period.
The average rise of 1.6m per century … is roughly twice as high as the maximum
estimates in the IPCC Fourth Assessment Report, and so offers the first potential
constraint on the dynamic ice sheet component that was not included in the headline
IPCC values.
Last year, a separate study found sea level rise projections could be under-estimating
the impact of human-induced climate change on the world’s oceans.
Stefan Rahmstorf, from the Potsdam Institute for Climate Impact Research, Germany,
and colleagues plotted global mean surface temperatures against sea level rise,
and found that levels could rise by 59% more than current forecasts.
http://news.bbc.co.uk/1/hi/sci/tech/7148137.stm
http://www.nature.com/ngeo/journal/vaop/ncurrent/abs/ngeo.2007.28.html