AEA European member airlines report passenger growth of 7.1% to almost 363 million in 2011
Latest data from the 30 members of the Association of European Airlines (AEA) which report traffic data (this does not include airberlin and Olympic Air) shows that passenger numbers in 2011 were up +7.1% compared to 2010 to almost 363 million. Capacity (ASKs) is up 8.9% while traffic (RPKs) is up 8.0%, resulting in a load factor drop of 0.6% to 77.3%. Due to the troubles in North African countries, far fewer (about -23% fewer) European passengers travelled there. Cross-border Europe was up 9.7%. Domestic traffic grew + 2.7%. BA passengers were up + 11.6%. Virgin down – 0.%. BMI down – 7.5%. Over the 30 airlines covered, load factors were down 0.6%.
AEA member airlines report passenger growth of 7.1% in 2011; load factors down from 77.9% to 77.3%
8.2.2012 (Anne Aero)
Latest data from the 30 members of the Association of European Airlines (AEA) which report traffic data (this does not include airberlin and Olympic Air) shows that passenger numbers in 2011 were up 7.1% to almost 363 million. Capacity (ASKs) is up 8.9% while traffic (RPKs) is up 8.0%, resulting in a load factor drop of 0.6 percentage points to 77.3%.
 Source: AEA
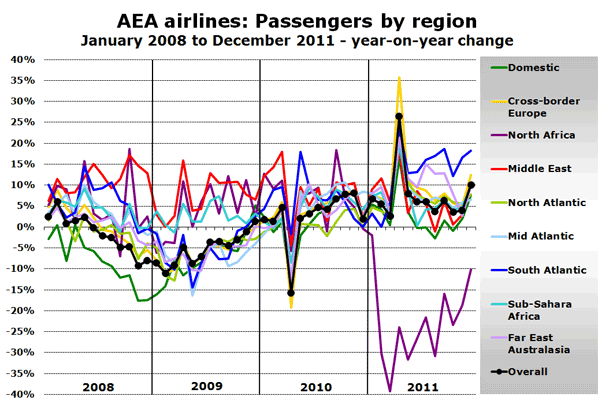
Monthly figures for individual geographic markets highlight dramatically the impact in traffic to and from North Africa as a result of the various political developments in the region during the year. Although the trend is improving even in December passenger numbers were down over 10%.
December was a deceptively good month for the airlines as a result of decent weather across Europe compared with December 2010 when heavy snowfall resulted in many services being cancelled.
Apart from the 23.2% reduction in passenger numbers to North Africa in 2011, domestic traffic grew by only 2.7%, while South Atlantic traffic was up 13.0%.
Cross-border Europe was up a healthy 9.7%.
AeroSvit and Ukraine International lead growth rankings
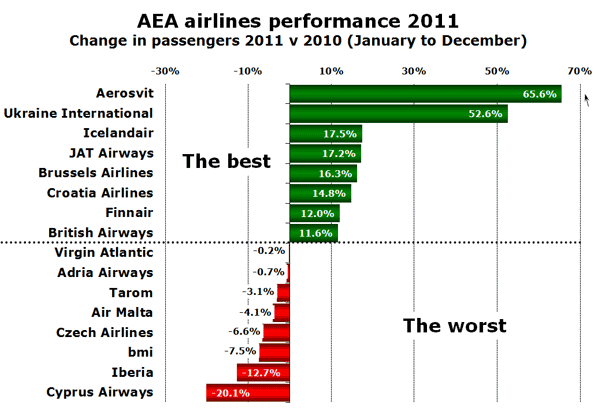
In 2011 22 of the 30 AEA member airlines that report traffic figures reported growth, with 11 airlines even reporting an increase in passenger number of more than 10%. Leading the way with growth of 65.6% is AeroSvit, which also reported an improvement of 2.2 percentage points in its average load factor to 71.9%. Another Ukrainian carrier, Ukraine International, ranked second with growth of 52.6%. Its load factor also improved, by 8.9 percentage points to 66.7%.
 Source: AEA
The eight airlines that welcomed fewer guests on board comprised the flag-carriers of the Czech Republic, Cyprus, Malta, Romania, Slovenia and Spain, plus two UK carriers; Virgin Atlantic and bmi British Midland International.
 Source: AEA
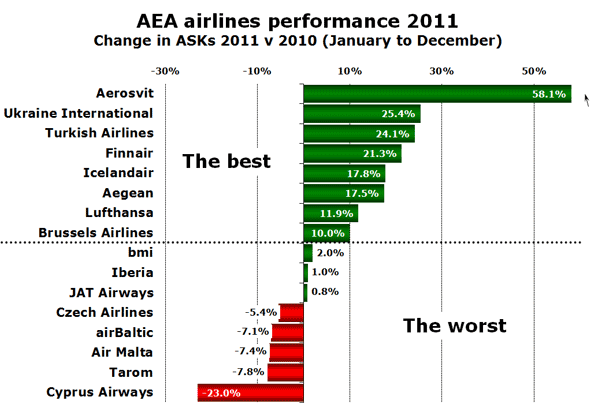
If instead of passenger numbers the figures for capacity (as measured by ASKs) is considered then some significant changes can be observed. Turkish Airlines, whose passenger numbers grew by 11.0%, increased capacity by 24.1% which reflects the increase in average sector length driven by the airline’s increase in international capacity and the launch of some 20 new international routes in 2011.
Another interesting case is airBaltic which reported a 4.5% increase in passenger numbers on a 7.1% reduction in capacity. This was achieved thanks to a 5.9 percentage point increase in load factor to 73.7%.
Load factors down overall but up at 15 of 30 airlines
Overall the average load factor across all 30 airlines fell by 0.6 percentage points to 77.3%. However, 15 of the 30 reporting airlines still managed to increase their load factor in 2011 compared with 2010. The biggest percentage point increases have been achieved by JAT Airways (plus 10.4 points), Ukraine International Airlines (plus 8.9 points), Air Malta (plus 6.5 points), airBaltic (plus 5.9 points) and Croatia Airlines (plus 5.2 points).
For 2011 as a whole just four AEA member airlines reported average load factors in excess of 80%, with KLM (84.4%) beating Swiss (81.8%), Iberia (81.3%) and Air France (80.4%). The lowest load factors in 2011 were reported by Tarom (60.6%), Luxair (58.2%) and bmi (56.8%).
http://www.anna.aero/2012/02/08/aea-member-airlines-report-passenger-growth-of-7-1pc-in-2011/
British Airways passengers ( Wikipedia )
Year to
| 31 March 2010 | 31,825,000 |
| 31 March 2009 | 33,117,000 |
| 31 March 2008 | 34,613,000 |
| 31 March 2007 | 33,068,000 |
| 31 March 2006* | 32,432,000 |
| 31 March 2006 | 35,634,000 |
| 31 March 2005 | 35,717,000 |
| 31 March 2004 | 36,103,000 |
| 31 March 2003 | 38,019,000 |
| 31 March 2002 | 40,004,000 |
| 31 March 2001 | 36,221,000 |
| 31 March 2000 | 36,346,000 |
| 31 March 1999 | 37,090,000 |
| 31 March 1998 | 34,377,000 |
| 31 March 1997 | 33,440,000 |
| 31 March 1996 | 32,272,000 |
Virgin Atlantic carried over 5.2 million passengers during 2010, a 2.3% reduction compared with 2009.[55]
| ||||||||||||||||||||||||||||||||||||||||||||||||
