Heathrow air pollution in relation to 2013 being the “Year of Air”
The European Commission has announced that 2013 is the ‘Year of Air’ with key European air pollution legislation up for review. The review represents a tremendous opportunity to improve public health by tightening air quality standards. Clean Air in London (CAL) believes that key outcomes from the ‘Year of Air’ must include continuity and the further tightening of health and legal protections. Increasing ‘flexibility’ in air pollution laws would weaken existing health and legal protections and is therefore unacceptable. There is a consultation by the EC, on options for the revision of the EU Thematic Strategy on air pollution and related policies, with the closing date on 4 March 2013. Heathrow is a major contributor to air pollution in West London, both from the airport itself and associated road traffic. Information from Hillingdon Council showed a clear correlation between the number of air transport movements and the levels of NOx.
Tweet
Information from the Clean Air in London website:
.
What is the ‘Year of Air’ in 2013?
The European Commission has announced that 2013 is the ‘Year of Air’ with key European air pollution legislation up for review. The review represents a tremendous opportunity to improve public health by tightening air quality standards. Commissioner Potočnik made speeches about the ‘Year of Air’ on 22 March 2011, 24 September 2012 and 8 January 2013.
The Commission has a webpage with details of the EU Review of Air Policy. So does the European Environment Agency.
Attempts are already being made by the UK authorities to weaken existing air pollution laws during the ‘Year of Air’.
For example, the UK Government has stated ‘Working in partnership with other Member States, we will also use the European Commission review of air quality legislation, expected in 2013, to seek…amendments to the Air Quality Directive which reduce the infraction risk faced by most Member States, especially in relation to nitrogen dioxide provisions’.
Similarly, the Mayor founded a group of 12 European cities and regions that signed a ‘Memorandum of Understanding’ on 10 November 2011 that emphasised ‘The revised [Air Quality] Directive shall include a degree of flexibility that allows the specific characteristics of our Regions to be taken into account’.
Given the Mayor promised Jenny Jones (Assembly Member) on 19 December 2012 that he will ‘oppose any watering down of the current European limit values for reducing air pollution…’ it seems likely that he hopes to achieve ‘flexibility’ through: delays to the legal deadlines; and/or ‘Partnership implementation agreements negotiated between the Commission and Member States in infringement, where further legal action would be suspended subject to proper implementation of agreed transparent and binding programmes to address air pollution’ (or similar) (which is being considered in the Commission’s consultation which closes on 4 March).
Clean Air in London (CAL) believes that key outcomes from the ‘Year of Air’ must include continuity and the further tightening of health and legal protections.
Increasing ‘flexibility’ in air pollution laws would weaken existing health and legal protections and is therefore unacceptable. CAL is publishing key events planned for the ‘Year of Air’ on its Facebook events page.
Please respond by 4 March 2013 to Commission’s consultation on options for the revision of the EU Thematic Strategy on air pollution and related policies.
There is a briefing page and consultations for four groups:
a shorter version for the public;
and three longer versions for experts and practitioners: citizens; organisations; and public authorities.
Please write also to your elected representatives in the European and UK Parliaments.
.
.
Hillingdon Council has produced a lot of information on the local air pollution they suffer.
Heathrow Airport – Air Pollution
Heathrow Airport (including the M4 and surrounding areas)
http://www.hillingdon.gov.uk/media/pdf/h/3/HeathrowAirportv2.pdf
There is much of interest, but one section states:
Heathrow Airport (including the M4 and surrounding areas)
The problems of air pollution in the Heathrow area have been recognised for a number of years and in a number of key national documents, including the National Air Quality Strategy, the Air Transport White Paper, and the Mayor’s Air Quality Strategy. Given the problems that already exist it is of considerable concern that Heathrow has not yet reached its authorised capacity (480,000 air transport movements and a terminal capacity of 80mppa). Reaching this capacity will bring increased pollutant emissions from the increased flights, increased on-airport emissions, and increases from extra road transport accessing the airport.
The following sections provide new information that has emerged in the last year concerning the future of Heathrow and data concerning pollution levels, traffic flows and Air Traffic Movements (ATMs).
.
Heathrow’s contribution to emissions across the Borough
Activities at Heathrow (from aircraft emissions and operations at the airport), make up over half of the total emissions across the Borough. The contribution of Heathrow and the road network together makes up over 80% of the Borough’s emissions, with much of the traffic being on roads that are not the responsibility of the Borough Council.
Quantifying the impact of the airport on air quality in different parts of the Borough has always been a controversial subject with regards to what element of the source mix is contributing at each location.
[The table] … shows that airport emissions contribute significantly to NOx levels in the southern half of the Borough but not the north. Emissions from traffic on major roads are significant wherever such roads exist. Contributions from background (sources outside the Borough) and ‘other’ (which includes traffic on minor roads) are also significant, but not dominant, throughout the AQMA. (Air Quality Management Area).
.
Air traffic movements and NO2
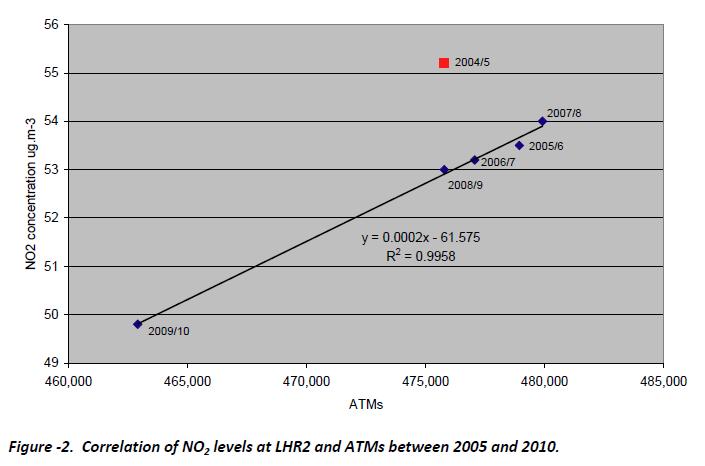
Concentrations of NO2 at the LHR2 monitoring station inside the airport fell in 2009 compared to previous years. There is, however, a question of whether the decline is a result of measures taken under the Action Plans introduced by Hillingdon, neighbouring local authorities and BAA, or whether it is a consequence of a reduction in flights linked to the economic downturn.
Figure 2 shows that there is almost a perfect correlation between ATMs and air quality at the LHR2 monitoring station on the airport since 2005 in other words, more than 99% of the variability in NO2 levels appears to be explained by variation in ATMs). Going back further, however, for example considering the 2004/5 data shown in red in the graph, the relationship breaks down – it would be interesting to know if there were any changes at the airport at this time that could explain this shift. However, the correlation for the following years is sufficiently good that it is worth noting for future reference as it may be useful in providing direct insight on the level of change in airport activities needed to bring about a change in concentrations that is significant in the context of the Action Plan.
.
and
With Heathrow, in particular, any changes to operational practices especially those that may also lead to increases in the number of flights on the existing 2 runways, may lead to unacceptable consequences for local air quality, for noise levels and for impacts on public transport capacity and congestion of the surrounding road network.
.
.
How bad is air pollution in London?
• London has the highest levels of nitrogen dioxide (NO2) pollution of any capital city in Europe. Concentrations of dangerous airborne particles (PM10) also breach legal limits in several parts of the city particularly near waste management sites.
• Government estimates that some 440,439 Londoners were exposed to unlawful levels of NO2 in 2011 at background locations alone i.e. away from busy roads.
• London’s residents are not the only ones affected by poor air quality. Every day hundreds of thousands of people commute into the polluted heart of London. NO2 concentrations are well over twice legal limits and World Health Organisation (WHO) guidelines near many London roadside monitoring sites. NO2 limits are also breached at a larger number of city centre ‘background’ sites away from busy roads.
.
What are the health impacts of air pollution in London?
• Air pollution comprises particles and gases. The particles are categorised by their maximum diameter in microns e.g. PM2.5 and PM10. In practice, nitrogen dioxide (NO2), a toxic gas, is the only molecule within the gas category with relevant WHO guidelines and legal limits.
• Poor air quality has a significant impact on the health of London residents. The Mayor published a study in 2010 estimating 4,267 premature deaths in London in 2008 attributable to long term exposure to fine particles (PM2.5). These occur mostly as heart attacks and strokes. The Department of Health estimates 6.3% to 9.0% of all deaths in London in 2010 were attributable to long-term exposure to man-made PM2.5 alone.
• Children, the elderly and people with existing respiratory illness suffer disproportionately from the effects of air pollution. Over 1,100 schools in London are within 150 metres of the city’s busiest and most polluted roads (i.e. those that carry over 10,000 vehicles a day). Traffic pollution from such roads may be responsible for 15-30% of all new cases of asthma in children and chronic obstructive pulmonary disease in adults of 65 years of age and older.
.
Are there air pollution standards that London should be meeting?
• Legally binding, health based limit values have been set for several air pollutants by the European Union since 1999. London is failing to meet these for PM10 and NO2.
• For PM10 London was required to meet limit values by 2005 but obtained unlawfully a time extension in 2011 to comply that year. That time extension has now expired but London has continued to exceed PM10 limits known as ‘Bad Air Days’ particularly near waste management sites e.g. Neasden Lane in Brent.
• NO2 limits were required to be met by 2010. The Government has admitted they are not expected to be met in London before 2025 and has been caught seeking to weaken NO2 laws.
• The Commission is expected to commence infraction action against the UK early in 2013.
.
What are the authorities doing to reduce air pollution in London?
The Mayor of London’s Air Quality Strategy is not ‘fit for purpose’. The Mayor has also used Pollution Suppressor vehicles to reduce air pollution near air quality monitoring stations most-used to report legal breaches and warn the public of smog episodes. The Mayor has also been caught lobbying to weaken international air pollution laws.
Diesel engine exhaust, recently classified by the World Health Organisation as carcinogenic to humans, is a particular problem in London which has: some 8,500 diesel buses; over 20,000 diesel taxis; and a low emission zone that is two steps and two years behind the equivalent in Berlin. A ground breaking study by Policy Exchange found that diesel vehicles are responsible for 95% of NO2 and 91% of PM2.5 exhaust emissions respectively from road transport in London.
The Government has not published a press release warning of smog since April 2011 when it made headline news. The Mayor also refuses to issue public warnings of smog even though Murad Qureshi AM discovered that hundreds of additional people in London have been admitted to hospital during smog episodes in the last five years alone.
http://cleanairinlondon.org/news/quick-guide-to-air-pollution/
and
.
Supporting guides, links and contacts
Health: ‘Invisible’ air pollution: the biggest public health failing or ‘cover-up’ for decades
Legal: UK is cheating on air quality laws and misleading the European Commission
Sources: London has the highest levels of NO2 of any capital city in Europe
Solutions: Manifesto for the Mayoral and London Assembly elections in 2012
there is a lot more detail at
http://cleanairinlondon.org/news/quick-guide-to-air-pollution/
=======
.
.
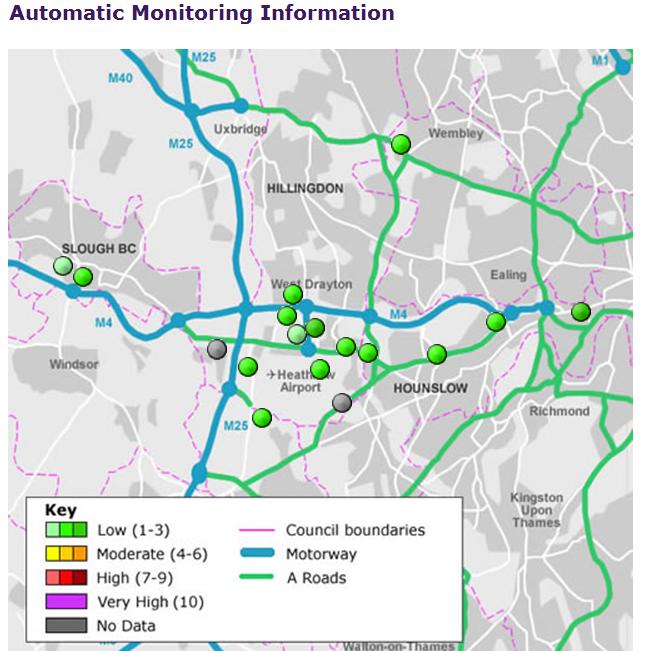
Below is a map, from the website of Heathrow Airwatch showing the air quality monitoring sites around Heathrow.
http://www.heathrowairwatch.org.uk/monitoring_information.php?action=aun
.
.
 The contribution of transport to air quality – TERM 2012.pdf [8.9 MB]
“The contribution of transport to air quality”
by the European Environment Agency, in 2012
The section dealing with air pollution from aviation states that:
5.3 Air pollution around airports
The main sources of air pollution around airports are aircraft, stationary sources and other mobile sources. Aircraft emissions are mainly associated with fuel combusted in the engines and auxiliary power units (APU), as well as tyre and brake wear.
In terms of local air quality, emissions during the landing take-off (LTO) cycle are important, as they include emissions produced during idle, taxi to and from terminal gates, take-off and climb‑out, and approach to the airport.
Emissions from stationary sources are largely associated with power generation (including heating/cooling units). Other mobile sources include ground support
equipment (e.g. mobile generators, tugs, baggage handling equipment, fuel trucks/loaders), airside vehicles (service vehicles, tankers, catering trucks) and other traffic that facilitate access to the airport (e.g. buses, taxis, trucks, passenger cars, rail). The main pollutants of concern around airports are NOX, PM (including ultrafine particles — see Box 5.4) and VOCs.
Several studies have evaluated the air quality around airports in Europe, the results of which gave rise to concerns. For example, high NO2 concentration levels are often measured at London’s Heathrow airport.
During 2011, the annual average limit value was exceeded at one monitoring site within the airport boundary and two sites within a 2 km distance of the airport (GLA, 2012).
The contribution to NOX concentrations from Heathrow airport activities has been assessed based on measurement data close to the airport. The results show that aircraft NOX sources can be detected at least 2.6 km from the airport, even though the
airport contribution at that distance is very small. [compared to the NOx from road traffic].
Approximately 27 % of the annual mean NOX and NO2 concentrations at the airfield boundary could be attributed to airport operations, with less than 15 % at background locations 2–3 km downwind of the airport (Carslaw et al., 2006).
Modelling undertaken at Heathrow Airport on emissions data from April 2008 to March 2009 confirms the above by estimating relatively high (about 30 %) airport‑related NOX
concentrations within the airport boundary, decreasing considerably with distance (11–19 % at about half a kilometre away) (HAL, 2011).
Another example is Zurich Airport, where monitoring data in 2008 were above the limit values for NO2, PM10 and O3 in the centre of the airport and at other locations dominated by road traffic.
Dispersion modelling and sensitivity analysis were also undertaken in 2008 to assess the contribution from activities at Zurich Airport to ambient air quality, particularly on NO2. The results show that airport activities significantly impact the air quality at the airport perimeter (> 25 %) for NO2.
The airport contribution to NO2 concentrations decreases rapidly with distance and becomes less than 10 % within one kilometre from the airport boundary (Flughafen Zürich, 2009). Additional conclusions from this study that are applicable to other airports
are outlined below:
• the significance of airports in the context of local air quality is not only determined by the
total emissions in the airport area but also the different heights at which emissions occur;
• ground-based airport activities, typically from road vehicles, contribute more towards high concentrations within the airport boundaries and along the access roads where exposure is greatest compared to aircraft. Aircraft emissions are dispersed over a larger area, but generally result in lower concentrations;
• the distribution of NOX concentration is more dependent on meteorological conditions than on a variation in emissions.
The air quality impacts from the closure of national airspaces and the suspension of air traffic due to the volcanic eruption in Iceland in 2010 were assessed at, and around, 14 airports across Europe.
The closure of airspace also affected other airport operations, such as transport to and from the airport. During the airspace closure, lower NO2 concentrations were observed, showing a correlation with the reduction in air traffic. However, the study considered this correlation weak in view of wider observations, based on one month’s monitored data.
The study concluded that the major disruption and reduction of flight activity did not significantly reduce air quality concentrations of NO2; nonetheless, the very local effects resulting from the emissions changes were noted (i.e. monitoring stations at or close to the airport showed lower NO2 concentrations). Meteorological conditions such as
wind speed showed a more significant influence on measured concentrations (ACI, 2010).
6.3 Effects of aviation emissions on air quality
Emissions from the aviation sector contribute very little to EU‑27 total emissions. International and national aviation (including both the LTO (landing and take off) and
cruise cycle) was responsible for around 4 % of NOX emissions, and less than 1 % of SO2 emissions, VOC emissions, PM emissions and CO emissions in EU Member States in 2010 (TERM 03).
Emissions of CO and VOC from aviation are generally low, when compared with emissions from other transport modes. NOX emissions are relatively high when
compared to other pollutants, even though the International Civil Aviation Organisation (ICAO) has established aircraft engine emission standards for NOX and has gradually made these more stringent over time.
Nevertheless aviation continues to be a growth sector and it is important to have appropriate policies in place to control pollution (see Box 6.5). When compared to other transport modes, a key difference for aviation is that aircraft emissions occur at different altitudes as emissions are released during the whole flying cycle. Activities below 3 000 feet (i.e. about 915 m) are commonly referred to as the LTO cycle, comprising taxi-out, take-off, climb out, landing approach and taxi-in.
Activities that take place at altitudes above 3 000 feet include the climb out, cruise and descent.
The effect of aircraft emissions on local air quality around airports has been discussed in Section 5.3. It should be noted that emissions above 3 000 feet are typically not considered when undertaking local air quality assessments for airports. However, it
has been estimated that NOX and SO2 emissions in the non-LTO phases are dominant and constitute over 90 % of the total aircraft emissions in Europe, whilst for CO and non-methane VOCs emissions were estimated to be about 40 % of total emissions.
Global non-LTO NOX emissions have a small but still significant impact on surface air quality in Europe; more specifically they contribute 1 % to average annual secondary inorganic aerosol, NO2 and O3 concentrations.
The contribution of LTO emissions from aviation is generally an order of magnitude smaller; thus considered to be of little significance for European air quality at a regional scale.
However, specifically for NO2 concentrations in the vicinity of airports, European non-LTO and LTO NOX emissions have been estimated to contribute 1 % to 2 % to surface concentrations (Tarrasón et al., 2004) though at some large airports such as Heathrow
the combined contribution of emissions from aircraft and other airport operations make a larger contribution to surface concentrations of NO2 (Carslaw et al., 2006) (see Section 5.3).
Box 6.5 Key policies for controlling emissions from the aviation sector
Pollutant emissions from aircraft are regulated by the International Civil Aviation Organisation (ICAO) through its Committee on Aviation Environmental Protection (CAEP). Emission standards for engines are currently in place for smoke, unburned hydrocarbons (HCs), CO and NOX during the LTO cycle. For the latter, since its first introduction in the 1980s, the NOX standard has been reduced by 50 %. An aircraft CO2 emissions standard is expected to be established by 2013 (ICAO, 2010). A PM certification standard is expected to be established by 2016.
The EU ETS Directive (2003/87/EC) and its subsequent amendments established an emission trading system that sets a limit on the total amount of certain GHGs emitted by the sectors covered. Aviation is one of these sectors, so airlines receive tradeable emission allowances for a certain level of CO2 emissions and after a year need to
surrender a number of allowances equal to actual emissions. This measure may reduce fuel consumption, which could reduce air pollution; however, more fuel-efficient engines tend to operate with a higher pressure ratio and emit more NOX.
Furthermore, the low carbon sustainable fuels target for the sector (EC, 2011a) may also
reduce emissions of the air quality pollutants SO2 and PM due to their lower sulphur content (SWAFEA, 2011).
In addition, the deployment of the modern air traffic management infrastructure, the Single European Sky ATM Research (SESAR) project by 2020 is expected to achieve 10 % of fuel savings, leading to a 10 % reduction of CO2 emissions per flight (Eurocontrol, 2010).
—–
Box 5.4 Ultrafine particles at airports
Ultrafine particles are particles with a diameter of less than 100 nanometres. There are no regulations specifically targeting these particles, although these are thought to be particularly harmful to human health.
Various studies have noted that aircraft contribute considerably to ultrafine particle pollution, as do road vehicles and ships. (US EPA, 2010; Paulsen, 2009). More recently in 2010–2011, a study focusing on air pollution at Danish airports conducted stationary measurements of ambient air quality at and around Copenhagen Airport.
With regards to ultrafine particles, the study found that the average 24 hour concentration within the airport boundaries at one site was two to three times higher than on city streets with heavy traffic, while ultrafine particle concentrations within the airport boundaries at two other sites were only 20–30 % below those in streets with heavy traffic.
This shows that concentration levels varied significantly within the airport boundaries. It is interesting to note that the two stations that showed lower concentrations are the official monitoring stations used in accordance with the environmental approval, while the one with the highest concentration was an additional one, placed in the airport yard close to employees loading and handling aircraft.
During the main working hours, concentrations within the airport boundaries were higher than those on city streets with heavy traffic. This was the case for two stations for which monitoring data were available (The Danish Ecocouncil, 2012).
—-
Carslaw, D., 2005, ‘Evidence of an increasing NO2/
NOX emissions ratio from road traffic emissions’,
Atmospheric Environment, 39 (26), 4 793–4 802.
http://www.sciencedirect.com/science/article/pii/
S1352231005005443) accessed 3 August 2012.
.
Carslaw, D. and Beevers, S. D., 2005, ‘Estimations
of road vehicle primary NO2 exhaust emission
fractions using monitoring data in London’,
Atmospheric Environment, 39 (1) 167–177, (http://
www.sciencedirect.com/science/article/pii/
S1352231004008775) accessed 3 August 2012.
.
Carslaw, D., Beevers, S., Ropkins, K. and Bell, M.,
2006, ‘Detecting and quantifying aircraft and other
on-airport contributions to ambient nitrogen oxides
in the vicinity of a large international airport’,
Atmospheric Environment, (40) 5 424–5 434,
( http://www.sciencedirect.com/science/article/pii/
S1352231006004250 ) accessed 3 August 2012.
.
Carslaw D., Beevers, S., Westmoreland E., Williams,
M., Tate, J., Murrells, T., Stedman, J., Li, Y., Grice,
S., Kent A, and Tsagatakis, I., 2011, Trends in NOX
and NO2 emissions and ambient measurements in the
UK, Department for Environment, Food and Rural
Affairs, London, (http://uk-air.defra.gov.uk/reports/
cat05/1108251149_110718_AQ0724_Final_report.pdf) accessed 3 August 2012.
The contribution of transport to air quality – TERM 2012.pdf [8.9 MB]
.
.
see also
EC stance on air pollution in London could affect ability of Heathrow to expand
November 17, 2012 Government plans to delay air pollution improvements in 12 areas of the UK areas were refused by the European Commission in June. The UK may now face fines if it fails to improve air quality quickly. The worst offender is London, where it is estimated that there over 4,000 ‘excess deaths’ per year from air pollution. This could have implications for Heathrow expansion. Air pollution is recognised by the government as the 2nd-biggest public health threat, after smoking. A judgement will be made at a later date on government plans to delay meeting NO2 standards in major cities until 2020 – or in the case of London, 2025. The EC decision addresses the shorter term, whereas a 3rd runway at Heathrow could not be operation for about 10 years. However, the tough stance by the EC suggests that any plan for Heathrow expansion, which increased air pollution and prevented limits being met, would face legal action. Click here to view full story…
and
Is air pollution the biggest obstacle to a third runway at Heathrow?
September 7, 2012 Alan Andrews, from Client Earth (a group of environmental lawyers) writes that though Cameron’s reshuffle might have removed a couple of high profile political obstacles to a third runway, it has not dealt with the more difficult obstacle: EU air quality limits. EU law sets legally binding limits on levels of harmful pollution in our air. These limits, which are based on WHO guidelines, govern a number of pollutants which are damaging to human health. The limits for NO2 are currently being broken in towns and cities throughout the UK. But they are worst in London – which is thought to have the worst levels of NO2 of any EU capital. Where limits are breached, EU law requires that an action plan be drawn up which achieves compliance in the “shortest time possible.” The Government’s plan for London shows that limits won’t be achieved until 2025. Alan explains how this means expanding Heathrow would be subject to legal challenge and EU opposition. Click here to view full story…