.
.
.
.
.
.
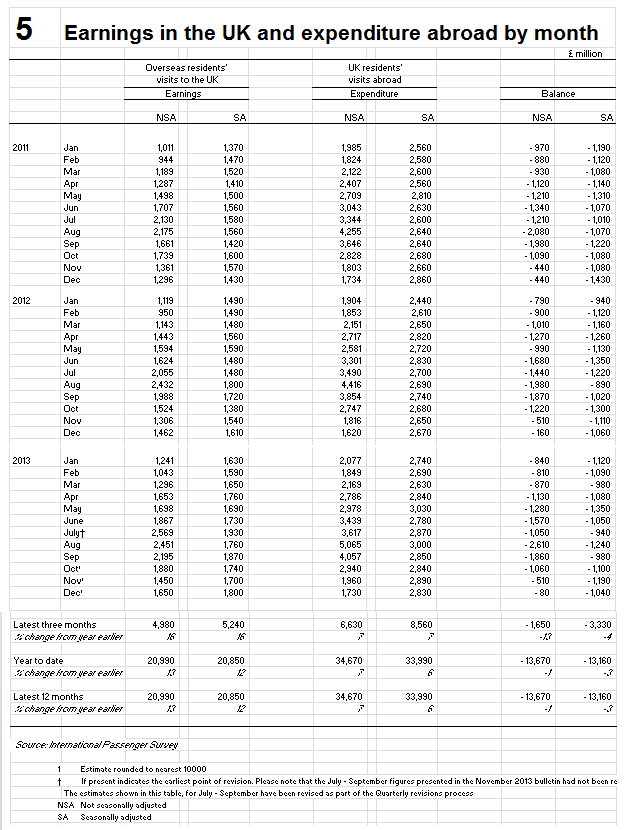
Data from the ONS (the government’s Office of National Statistics) shows each year how many foreign tourists visit the UK and how many Britons travel abroad, for holidays or business or to visit friends and family. The figures for 2013 show that the “tourism deficit” (the difference between the money spent by inbound visitors to the UK, and the money spent by Brits on their trips abroad) remains around £13.7 billion. So we export much more money by our air trips than we get into the UK economy from foreign visitors coming here. The countries with the largest number of visitors to the UK remain, in descending order, France, Germany, USA, Ireland, Netherlands, Spain, Italy and Poland. The countries which pay the most into the UK economy from their visits are, in descending order, USA, Germany, France, Australia, Spain, Italy, Ireland and Netherlands. The countries whose citizens spend the most per day are the UAE and other Middle East countries, Egypt, Nigeria, Norway, Denmark, Hong Kong and Russia. 51% of all overseas visitors come to London. The countries whose citizens spend most in London are Americans and Middle Eastern countries.
.
Tweet
http://www.ons.gov.uk/ons/rel/ott/travel-trends/2013/info-visit-numbers.html

.
The top ten inbound markets for the UK in terms of number of visits during 2012 accounted for two in three visits (66%). It is noteworthy that only two long-haul markets, the USA and Australia, appear in the top ten. Looking at spending by inbound visitors, the top ten markets account for 54% of all spending, with the USA worth almost £1 billion more than the next most valuable market, France. All of the top ten markets measured in terms of value are ‘developed’ rather than ‘emerging’ source markets for international tourism.

https://www.airportwatch.org.uk/?p=18638
http://www.ons.gov.uk/ons/rel/ott/travel-trends/2013/info-london.html

Trends in visits to the UK by overseas residents
Trends in visits abroad by UK Residents
.
The latest ONS data shows the highest recorded number of overseas visits to the UK since 1961. There were 32,813,000 visits to the UK in 2013, a 5.6% increase since 2012. Over the same year, spending by overseas visitors increased by 12.7% to £21,012m. The number of visits to London in 2013 was the highest since 1961, with half of all visitors to the UK visiting London. There were 16.8m overseas visitors to London in 2013 and they spent £11,256m.
A total of 16.8m overseas visitors visited London during their visit to the UK in 2013. This was the highest recorded number of overseas visitors since 1961. The proportion of all overseas visitors to the UK who visit London has been increasing steadily over the last ten years, from 47.3% in 2003 to 51.2% in 2013.
Two-thirds of visitors from North America and other countries outside of Europe visited London during their visit to the UK in 2013 (65.8% and 67.1% respectively). Just under half (48.6%) of European visitors to the UK visited London in 2013. Half of all overseas visitors visiting London were on holiday. Over the last ten years, the number of overseas visitors visiting London for a holiday has increased from 4.9m in 2003 to 8.5m in 2013 (71.9%). Over the same period business visits have increased by 18.5% and visits to friends and family increased by 34.8%.
Over the last 10 years the top 10 countries of residence for overseas visitors to London have remained fairly constant. In both 2003 and 2013 visitors from the United States of America, France and Germany were the top three visiting countries.
| 2003 | 2013 | |||||
|---|---|---|---|---|---|---|
| 1 | USA | 2,234 | 1 | USA | 1,884 | |
| 2 | France | 1,191 | 2 | France | 1,873 | |
| 3 | Germany | 892 | 3 | Germany | 1,338 | |
| 4 | Irish Republic | 624 | 4 | Italy | 1,091 | |
| 5 | Netherlands | 619 | 5 | Spain | 843 | |
| 6 | Italy | 601 | 6 | Netherlands | 696 | |
| 7 | Spain | 527 | 7 | Australia | 696 | |
| 8 | Australia | 451 | 8 | Irish Republic | 619 | |
| 9 | Canada | 317 | 9 | Belgium | 533 | |
| 10 | Sweden | 308 | 10 | Sweden | 523 | |
Table source: Office for National Statistics
Expenditure in the UK by overseas visitors in 2013 had increased by 12.7% since 2012 to £21,012m. Of this overall expenditure, 53.6% was spent in London. The amount spent by overseas visitors in London almost doubled (increased by 91.9%) between 2003 and 2013. Overseas visitors spent £11,256m in London in 2013 compared to £5,867m in 2003. The increase in spending has been largely driven by the increase in holiday visits to London over this period. In 2013, just under a half (47.9%) of spending by overseas visitors in London was by those on holiday.
In both 2003 and 2013, visitors from the United States of America were the highest spenders in London. The top 10 spending countries have changed over the last 10 years, with countries from Asia, Central and South America, and the United Arab Emirates replacing the Netherlands, the Irish Republic and African countries as high spenders.
The average spend per visitor to London is higher for some countries than others which explains why the list of top 10 visiting countries is different to the top 10 spending countries. Visitors from the United Arab Emirates and countries in Central and South America, Asia and the Middle East have a higher average spend per visitor than countries, such as France, Germany and Italy that have higher number of residents visiting London.
| 2003 | 2013 | |||||
|---|---|---|---|---|---|---|
| 1 | USA | £1,412 | 1 | USA | £1,526 | |
| 2 | France | £332 | 2 | Other Middle East | £888 | |
| 3 | Italy | £293 | 3 | France | £677 | |
| 4 | Germany | £290 | 4 | Germany | £557 | |
| 5 | Australia | £235 | 5 | Australia | £552 | |
| 6 | Netherlands | £222 | 6 | Italy | £513 | |
| 7 | Spain | £221 | 7 | Spain | £483 | |
| 8 | Other Middle East | £209 | 8 | Other Asia | £411 | |
| 9 | Other Africa | £199 | 9 | United Arab Emirates | £359 | |
| 10 | Irish Republic | £173 | 10 | Other Central & South America | £335 | |
Table source: Office for National Statistics
These statistics were analysed by the International Passenger Survey team at ONS. The analysis was based on data from the International Passenger Survey. If you would like to find out more about overseas travel and tourism, you can read the release, view the infographic, or visit the travel and transport page. If you have any comments or suggestions, we would like to hear them. Please email us at: socialsurveys@ons.gov.uk
.
.
.
.
.
.
.