Heathrow airport announces highest ever number of passengers in 2014 – 73.4 million
.
Tweet
Heathrow and Gatwick report record passenger numbers in 2014
The UK’s two largest airports, Heathrow and Gatwick, have both reported record passenger numbers for last year.
There were 73.4 million passengers passing through Heathrow while 38 million people used Gatwick.
Each airport seized on its own growth as further evidence that it needs to be expanded with an extra runway.
Since 2012, the government’s Airports Commission, led by Sir Howard Davies, has been looking at where the UK’s airline capacity can be expanded.
Heathrow argued that it was the only viable location for more direct flights to “growing cities” around the world.
Gatwick said it was the “obvious solution” for any airport expansion in south-east England.
Both airports have been lobbying and using advertising campaigns to back up their arguments that they alone should be the preferred location for any new runway.
….. and it continues, with the usual airport PR ….
http://www.bbc.co.uk/news/business-30775021
.
HEATHROW
Heathrow traffic and business commentary December 2014
12 January, 2015 (Heathrow Airport press release)
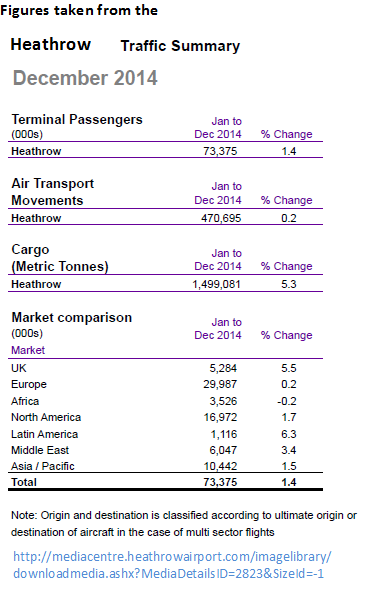
2014 Full-Year Traffic Results:
- A record 73.4 million passengers made journeys through Heathrow in 2014, an increase of 1.4% on 2013
- Fast-growing emerging markets continue to be a driver of traffic growth at Heathrow, with passenger volumes up 6.3% to Latin America, 5.2% to East Asia and 3.5% to the Middle East & Central Asia
- Growth of 2.5% in transfer passenger volumes at the UK’s only hub attracted more long-haul flights to growth markets like China and Mexico
- The UK’s largest port saw growth of 5.3% in cargo volumes to 1.5 million metric tonnes, helping more of Britain’s exports reach new markets [or just more to reach conventional markets??]
December 2014 Traffic Results:
- Heathrow saw its busiest ever December with 5.93 million passengers choosing to travel through the airport over the festive season, an increase of 2.4% on December 2013
- Larger, quieter aircraft continued to contribute to passenger growth at Heathrow. Seats per aircraft increased 0.6% to 208.4, while load factors remained strong at 76.6%. Passengers per aircraft rose 0.4% to 159.6
- Passenger volumes continued growth within emerging markets, increasing 15.1% to China, 10.9% to Mexico and 4.0% to the Middle East & Central Asia
- Heathrow continued to welcome the transfer passengers that make such long-haul routes viable, with year-on-year volumes increasing 4.7%
- Cargo volumes saw strong growth of 6.2% overall, including increases of 33.5% to Mexico, 29.4% to Brazil, 15% to Turkey and 11.2% to India
.
Heathrow in 2013
Over the whole of 2013 the number of Heathrow passengers was up + 3.4% compared to 2012, to 72,332,900 passengers.
The number of Heathrow Air Transport Movements was down – 0.4% compared to 2012 to 469,552 ATMs.
The number of metric tonnes of Heathrow air cargo was down – 2.8% compared to 2012 to 1,423,013 tonnes.
Heathrow monthly air passenger data over recent years
Heathrow monthly air passenger figures below taken from http://www.heathrowairport.com/static/HeathrowAboutUs/Downloads/Excel/12-Heathrow_Monthly_Traffic_Statistics(Jan2005-Dec2013).xls
| Heathrow passengers | 2005 | 2006 | 2007 | 2008 | 2009 | 2010 | 2011 | 2012 | 2013 |
| January | 5,141,123 | 5,112,718 | 5,013,163 | 4,957,887 | 4,853,191 | 4,830,092 | 5,052,726 | 5,169,518 | 5,184,924 |
| February | 4,753,591 | 4,734,688 | 4,641,466 | 4,828,048 | 4,370,846 | 4,600,406 | 4,621,717 | 4,798,785 | 4,848,548 |
| March | 5,708,627 | 5,491,143 | 5,646,977 | 5,612,269 | 5,193,571 | 5,211,877 | 5,331,451 | 5,697,132 | 5,921,068 |
| April | 5,573,022 | 5,811,931 | 5,667,573 | 5,467,910 | 5,612,596 | 4,446,530 | 5,848,560 | 5,849,171 | 5,806,681 |
| May | 5,636,621 | 5,716,741 | 5,610,629 | 5,645,161 | 5,424,789 | 5,255,772 | 5,865,558 | 5,831,840 | 6,105,232 |
| June | 6,000,208 | 6,122,230 | 6,014,542 | 5,958,635 | 5,775,828 | 5,783,051 | 6,146,986 | 6,245,553 | 6,531,933 |
| July | 6,456,943 | 6,533,091 | 6,419,432 | 6,417,660 | 6,477,476 | 6,705,882 | 6,872,514 | 6,569,647 | 6,930,334 |
| August | 6,120,139 | 5,987,755 | 6,378,156 | 6,365,717 | 6,383,692 | 6,542,496 | 6,585,442 | 6,459,119 | 6,959,544 |
| September | 6,042,020 | 5,896,743 | 6,022,156 | 5,802,706 | 5,783,611 | 6,221,219 | 6,310,903 | 6,345,935 | 6,559,112 |
| October | 5,713,074 | 5,630,492 | 5,844,064 | 5,630,399 | 5,687,438 | 6,097,490 | 6,019,465 | 6,011,761 | 6,289,291 |
| November | 5,208,222 | 5,099,094 | 5,221,947 | 4,971,829 | 5,028,739 | 5,243,163 | 5,218,862 | 5,381,138 | 5,411,354 |
| December | 5,332,860 | 5,206,233 | 5,374,953 | 5,251,674 | 5,316,129 | 4,809,195 | 5,517,264 | 5,625,269 | 5,784,898 |
| Full year (million) | 67,686.5 | 67,342.9 | 67,855.1 | 66,909.9 | 65,907.9 | 65,747.2 | 69,391.4 | 69,984.9 | 72,332.9 |
.
Heathrow historical passenger, ATM and cargo statistics
CAA Aviation Statistics for Heathrow:
2006 67,339,000
2005 67,683,000
2000 64.227,000
1996 55,726,000
Air Transport Movements
2007 476,000
2006 471,000
2005 472,000
2000 480,000
1996 427,000
Air Freight:
2007 1,310,987
2006 1,263,129
2005 1,305,686
2000 1,306,907
1996 1,040,486
Heathrow Annual statistics
Heathrow says: “Every year we publish detailed traffic statistics covering the most popular routes and destinations, the busiest airports, the top airlines and the busiest times.
Heathrow Airport traffic statistics 2013 (1.1MB PDF)
Heathrow Airport traffic statistics 2012 (932KB PDF)
Heathrow Airport traffic statistics 2011 (895KB PDF)
Heathrow Airport traffic statistics 2010 (757KB PDF)
Heathrow Airport traffic statistics 2009 (790KB PDF) ”
.