Heathrow Airport – General Information and Noise
back to Heathrow page
Local residents’ or airport opposition groups:
HACAN is the main group. www.hacan.org.uk
and Richmond Heathrow Campaign
and SHE (Stop Heathrow Expansion)
and Aircraft Noise Lightwater, Windlesham and Bagshot, Surrey
and Teddington Action Group – against increased flight noise
and Hammersmith & Fulham No 3rd Runway
and Ealing Aircraft Noise Action Group
and Brentford & Hounslow Stop Heathrow Expansion BASHR3
.
NOISE
Reporting complaints about Heathrow aircraft noise
This is Heathrow Airport’s page on which people can report a noise complaint (they delicately call them noise enquiries). Heathrow says:
“Let us know about a noise incident in your area. Log a noise enquiry “
Daily flight data:
Heathrow Webtrak – “Track flights on maps”
There is now also “xPlane” which enables people to check planes overhead /nearby a chosen postcode.
You can read the short introduction on how to use it at http://www.heathrow.com/file_source/HeathrowNoise/Static/How_to_use_xPlane.pdf
and then select your postcode to look at, and how wide an area round it you want to see. You can go back two years, and look at from 1 – 7 days of flights. It shows a graphic with the planes, and their heights. You can click on each to get altitude, whether arrivals or departures, weight category of plane and its passenger capacity etc. You cannot see which airline it was or its destination. There is also a summary at the bottom of all planes that flew through that “gate” (ie a cross section of airspace above your postcode) in your chosen period. And their heights. An example is shown below:
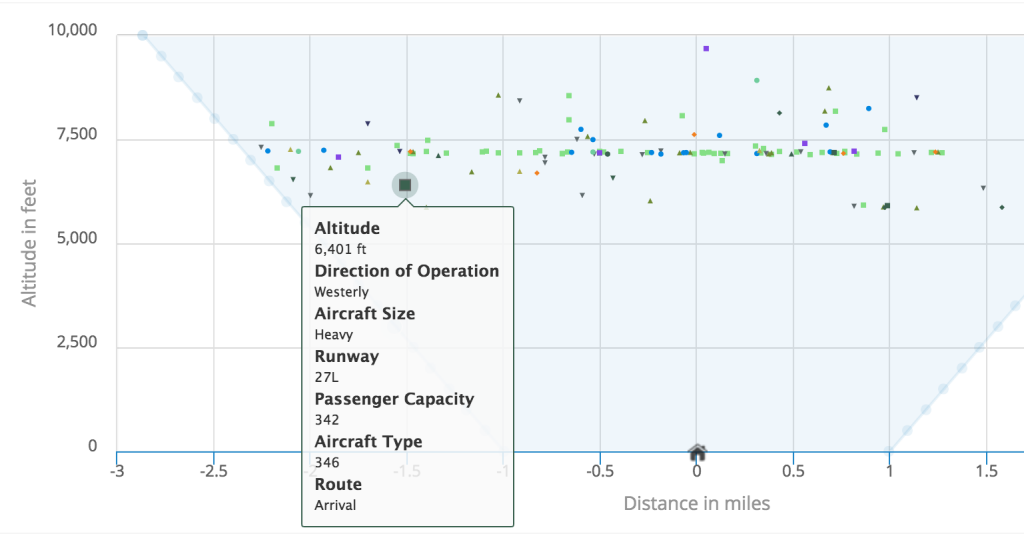
Worth a try. It does give more info, in a more usable form, than just Webtrak.
http://xplane.bksv.com/xplane/
Publications about Heathrow, showing why it does not need to expand, and why it should not be expanded. Reports on Heathrow
Analysis of flights, routes, and top 10 destinations from Heathrow Airport in 2011. Also carbon emissions. And passenger growth and numbers over the past 15 years. http://www.awsw.co.uk/allco2/LHR_co2.html
Heathrow’s busiest international routes in 2012.
Table from Wikipedia. Their data is from the CAA at http://www.caa.co.uk/docs/80/airport_data/2012Annual/Table_12_1_Intl_Air_Pax_Route_Analysis_2012.pdf
Just the top 20 are shown – the original on Wikipedia has the entire list.

Of the domestic routes, in 2012 only Edinburgh would feature in the top 20.
| Edinburgh | 1,254,993 | |
It would be the 9th busiest route. Glasgow is the 2nd busiest domestic route with 828,532 passengers in 2012 – it would not come near the top 20 routes (about 26th).
.
Data taken from the Heathrow Wikipedia page. Their data is from the CAA airport statistics.
 2013 Passengers 72,332,900 up + 3.4% Cargo 1,423,013 tonnes. down – 2.8% ATMs 469,552 down – 0.4%
Heathrow’s terminals
Heathrow website: “Passenger volume by terminal (millions) 2012”:
- Terminal 1 – 13.6 million passengers on 119,183 flights
- Terminal 2 – closed for construction
- Terminal 3 – 18.6 million passengers on 96,326 flights
- Terminal 4 – 9.8 million passengers on 59,955 flights
- Terminal 5 – 28.1 million passengers on 193,440 flights
CAA Aviation Statistics for Heathrow:
2006 67,339
2005 67,683
2000 64.227
1996 55,726
Air Transport Movements
UK Airport Statistics: 2012 – annual (Table 4.2) ATMs 2002 – 2012
2007 476
2006 471
2005 472
2000 480
1996 427
Air Freight:
UK Airport Statistics: 2012 – annual (Table 13.2) Freight 2002 – 2012
2007 1,310,987
2006 1,263,129
2005 1,305,686
2000 1,306,907
1996 1,040,486
2006 8.9%
2007 8.5%
2008 8.3%
Business Aviation: Number of business flights (= private jets)
CAA statistics, annual figures – Table 3.1
Heathrow facts and figures, from the BAA website:
Size Total size of Heathrow Airport: 1,227 hectares
Number of runways: 2
Length of runways: Northern 3,902m x 45m. Southern 3,658m x 45m.
Movements Annual air transport movements in 2009: 460,026 [ In 2012 : 471,341 ].
Daily average air transport movements: 1,260 [ In 2012: 1,288 ]. 2% more
Vehicles per day/week passing through the tunnel: Approx 50,000 per day (entering the Central Terminal Area) 350,000 per week.
Aircraft stands Number of aircraft stands served by an air bridge: 112 Number of remote stands: 83
Destinations and airlines Number of airlines: 88 Number of destinations served: 185 [Updated 2012 Number of airlines: 84 Number of destinations served: 184 (in 80 countries) ] [They said in 2010: Number of airlines: 89 and Number of destinations served: 176 (in 90 countries) in 2010 ].
Most popular destinations in 2009:
- New York (JFK)
- Dubai
- Dublin
- Amsterdam
- Hong Kong
- Most popular destinations in 2010:
- New York (JFK)
- Dubai
- Dublin
- Amsterdam
- Paris (CDG)
Most popular destinations in 2012 (Frankfurt replaces Hong Kong and Paris):
- New York (JFK)
- Dubai
- Dublin
- Frankfurt
- Amsterdam
Employment [No employment figures are given on the above page for 2012].
Number of BAA staff at Heathrow in 2010: 4,385 (But they claim 6,422 in 2010)
Total employment at Heathrow Airport in 2010: 77,000 (compared with 76,500 in 2010)
.
Total jobs sustained by Heathrow across the UK: Approx 170,000
Passenger numbers Number of passengers arriving and departing per day: average 180,600 (split 50/50 between arriving and departing) [They say 191,200 for 2012].
Number of passengers arriving and departing in 2009: 65.9 million [70 million in 2012].
Busiest day ever recorded (passenger numbers): 18 July 2010 with 232,000 [They update this to 31 July 2011 with 233,561 after 2012]
Busiest month ever recorded (passenger numbers): July 2010 with 6.7 [No 2012 update]
Busiest year ever recorded (passenger numbers): 2005 with 67.69 million [Updated to 2012 with 69.98 million ].
Percentage of international passengers in 2009: 92% (60.6 million) [ 93% (65.3 million) in 2012] [ in 2010: 93% (60.9 million) ]
Percentage of domestic passengers in 2009: 8% (5.3 million) [7% (4.7 million) in 2012 ].
Percentage of business travellers in 2009: 33.7% (22.2 million) [ 30% (20.7 million) in 2012]. [ in 2010: 35.3% (23.2 million) ].
Percentage of passengers visiting friends and relatives in 2009: 30.2% (19.9 million)
Percentage of other leisure travellers in 2009: 36.1% (23.8 million) [ “Other leisure” in 2012 70% (49.3 million) ].
Percentage of transfer passengers: 37.5% (24.7 million) [ 37% (26.0 million) in 2012 ]. [ in 2010: 35.4% (23.3 million) ].
Percentages of domestic, European, North American and other long haul passengers
in 2009:
- Domestic – 8.0%
- Europe – 39.2%
- North Atlantic – 22.4%
- Other long haul – 30.4%
Passenger volume by terminal (millions) 2009:
- Terminal 1 – 12.0 million
- Terminal 2 – 3.9 million (Terminal 2 was closed for reconstruction in November
2009) - Terminal 3 – 20.4 million
- Terminal 4 – 5.1 million (Terminal 4 was refurbished and was not used at capacity
for much of 2009) - Terminal 5 – 24.4 million
Total airport: 65.9 million passengers
Passenger profile: AB: 49%; C1: 41%, C2: 8%, DE: 2%
Cargo tonnage in 2009: 1.3 million metric tonnes
Heathrow website in 2014:
- Percentage of international passengers in 2013: 93% (67.3 million)
- Percentage of domestic passengers in 2013: 7% (5 million)
- Percentage of business travellers in 2013: 30% (20.7 million)
- Percentage of other leisure travellers in 2013: 70% (49.3 million)
- Percentage of transfer passengers in 2013: 37% (26.0 million)
- From
Heathrow income from retail
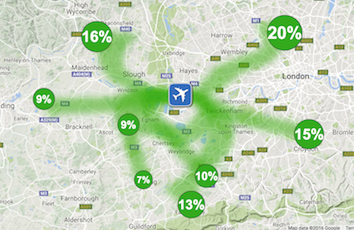
Heathrow expansion, in graphics, from 2007
(BBC article 23.11.2007 http://news.bbc.co.uk/1/hi/uk_politics/7107693.stm)
The UK’s largest airport, Heathrow in London, might have had a third runway as
as well noise footprints and some estimates for the flight paths that might have
been used.

would have meant 700 properties, including the village of Sipson, would have been
destroyed.

the government says noise becomes “a community annoyance”. There were 466,000
Air Transport Movements (ATMs) in 2002; defined as a plane taking off or landing.
of Heathrow’s runways. 540,000 ATMs a year, but before a third runway is built.
702,000 ATMs a year.

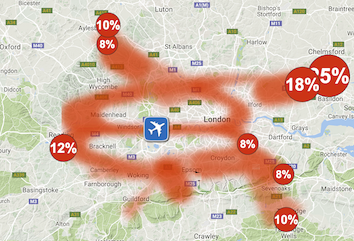
This option shows what might happen before a third runway is up and running. The
red boundary represents the area estimated to experience noise levels of 57 decibels.
Note: Flight paths are subject to change

currently planes land at one runway until 3pm and then on the other one for the
rest of the day. This is to give residents near each runway half a day’s break
from the noise. The swathes finish at the point planes are expected to reach 4,000ft.
The red boundary represents the area estimated to experience noise levels of 57
decibels. http://news.bbc.co.uk/1/hi/uk_politics/7107693.stm