CAA publishes SoNA study, showing high levels of annoyance from aircraft noise well below 57dB
On 2nd February the CAA published a report on a survey about attitudes to aircraft noise, done in 2014. It is called SoNA (Survey of Noise Attitudes). This follows the ANASE study done several years earlier, that was shelved by government, as its methodology was questioned, and it showed high levels of annoyance in response to plane noise. The SoNA study findings are that some adverse effects of plane noise annoyance can be seen to occur down to 51dB LAeq 16hr. The conventional level of averaged noise considered a problem is 57 dB LAeq, and noise is measured on a logarithmic scale. The SoNA report also found sensitivity to aircraft noise has increased, with the same percentage of people being highly annoyed at 54dB LAeq 16hr in SoNA as there was at 57dB LAeq 16hr in the ANIS study that was done in 1985. This gives further evidence to the demand that the government no longer uses the 57dB LAeq metric as its main noise measure. The debate continues about the merits of averaged noise over 16 hours in summer, with metrics measuring the number of plane noise events in a given time. The study says “there is insufficient evidence to link chronic health outcomes with event-based noise metrics, and SoNA 2014 found these performed less well than LAeq 16hr as a predictor of annoyance.” But the findings may show “it may be appropriate to use N65 as supplementary measure for daytime noise…”
.
Tweet
Reference: CAP1506
Title: “Survey of noise attitudes 2014: Aircraft”
Description: This report describes the Survey of Noise Attitudes 2014 (SoNA 2014), commissioned by the UK Government. It describes the approach to the study, the sampling strategy, the determination of the noise exposure, the analytical approach and the results.
Status:Current
The report is at
http://publicapps.caa.co.uk/docs/33/CAP%201506%20FEB17.pdf
http://publicapps.caa.co.uk/modalapplication.aspx?appid=11&mode=detail&id=7747
.
Publication of new official research on aircraft noise annoyance – SoNA
2.2.2017
AEF Director Tim Johnson commented:
Aircraft noise represents a serious and growing problem for people around airports and under flight paths. This new, Government-commissioned report provides authoritative evidence that a greater number of people are annoyed by noise at lower levels than in the past.
Airport noise assessments are currently based on out-of-date policies that underestimate the numbers of people affected. A new approach is needed if the impact of both today’s operations, and of any future airport growth, is to be properly understood.
The study published today, which took in to account the impact of noise on over 2000 people living near to nine of the major airports across England, found that the same percentage of respondents said to be highly annoyed at 57 dB in the Government’s 1982 study are now annoyed at 54 dB. It also found a significant link between increased noise annoyance and poor health.
The Government can no longer rely on the antiquated 57 Leq measurement as the cut-off for community annoyance. We welcome the fact that proposals released today on airspace change require noise at lower levels to be measured and taken into account., But evidence that aircraft noise annoyance is a bigger problem than the Government previously thought it to be now needs to be acted on, with a meaningful noise strategy, and targets for reducing the numbers affected. Link
.
The DfT commented:
In 2014 the Government commissioned a Survey of Noise Attitudes (SoNA) to investigate attitudes towards aviation noise and whether these have changed over the years. The results of this study have been published by the CAA19. It should be noted that SoNA’s findings relate to quality of life effects described by annoyance and consequently for health impacts it only considers self-reported health ratings compared to noise exposure and reported annoyance. Within that context, SoNA suggests that: • Some adverse effects of annoyance can be seen to occur down to 51dB LAeq 16hr; and • Sensitivity to aircraft noise has increased, with the same percentage of people being highly annoyed at 54dB LAeq 16hr in SoNA as there was at 57dB LAeq 16hr in a past study that influenced aviation noise policy.
There is insufficient evidence to link chronic outcomes on health with event-based noise metrics, and SoNA 2014 found these performed less well than LAeq 16hr as a predictor of annoyance. However the findings from SoNA do suggest it may be appropriate to use N65 as supplementary measure for daytime noise, which is recorded more often than N70 in areas with lower levels of noise exposure, as a metric to help understand the impact on those who will be affected by an airspace change. It also may help those who are affected to understand the impacts of proposals.
.
Copied below is the summary from the CAA report (pages 62 – 66):
.
Summary
The study aims as originally set out were:
Obtain new and updated evidence on attitudes to aviation noise around airports in England, including the effects of aviation noise on annoyance, wellbeing and health.
Obtain new and updated evidence on what influences attitudes to aviation noise, and how attitudes vary, particularly how attitudes vary with LAeq, but also other non-acoustic factors that may influence attitudes, such as location and time of day, and socio economic group of respondents
Examine whether the currently used measure of annoyance, LAeq, is the appropriate measure of annoyance for measuring the impact on people living around major airports.
Consider the appropriateness of the policy threshold for significant community annoyance from aviation noise.
Provide baseline results that can be used for a programme of regular surveys of attitudes to aviation noise.
“It is helpful to recast these into a series of sequential questions, which have been used to frame the following sections”
Is LAeq,16h still the most appropriate indicator to use to estimate the
annoyance arising from aircraft noise?
8.7 The study compared reported mean annoyance scores against average summer-day noise exposure defined using four different noise indicators:
LAeq,16h, Lden, N70 and N65.
8.8 Evidence was found that mean annoyance score correlated well with average summer day noise exposure, LAeq,16h (r2=0.87)40. There was no evidence found to suggest that any of the other indicators Lden, N70 or N65 (r2=0.60-0.71) correlated better with annoyance than LAeq,16h.
8.9 Having said this, the study recognises that residents can struggle to understand the concept of a time-averaged metric such as LAeq,16h and Lden and the fact that it is measured and reported on a logarithmic scale where a change of 3 dB representatives a doubling or halving of noise energy.
8.10 There is, therefore merit in considering greater use of Nx metrics as supplemental indicators to help portray noise exposure, but recognising that evidence-based decisions should continue to use LAeq,16h. In this context N65 is preferred over N70 as noise events in many areas are already beginning to occur at levels less than 70 dB LAmax and are
forecast to reduce over time.
Is summer day, average mode, still the best time period to use as
opposed to single-mode?
8.11 Whilst evidence was found indicating that easterly-mode noise exposure correlated best with mean annoyance score (r2=0.95), westerly-mode noise exposure was found to have the poorest correlation (r2=0.21). This occurs because respondents were found to be more annoyed by easterly mode noise exposure compared to westerly-mode for a given noise level.
Practically, this means that single-mode contours are unsuitable for decision making, but that they may be helpful for portraying exposure and changes to exposure.
8.12 Of the average-day modes, the existing 92 day summer average mode was found to correlate better (r2=0.88) than shorter average modes (r2=0.69-83). There was therefore no evidence found to support a change from the current practice of basing LAeq,16h on an average summer day.
How does annoyance relate to exposure?
8.13 Mean annoyance score and the likelihood of being highly annoyed were found to increase with increasing noise exposure (LAeq,16h). The relationship found was close to linear, though annoyance levels plateau at low exposure and do not reach zero annoyance.
How do the results compare with ANIS, ANASE & Miedema?
8.14 Annoyance scores were found to be comparable with those found for the ANASE restricted sites, but lower than found by the full ANASE study, and higher than found by ANIS.
8.15 For a given noise exposure, a lower proportion of respondents was found to be highly annoyed than compared with ANASE, the results of which were considered unreliable.
8.16 For a given noise exposure, a higher proportion of respondents was found to be highly annoyed than compared with ANIS. This is highlighted in Table 31, which presents tabular data from Figure 8 (Chapter 5), as an update to Table 3 of CAP 725 Appendix B.
[ANIS is Aircraft Noise Index Study (1982 survey reported in 1985) ]
Table 31: Percentage highly annoyed as a function average summer day noise exposure,
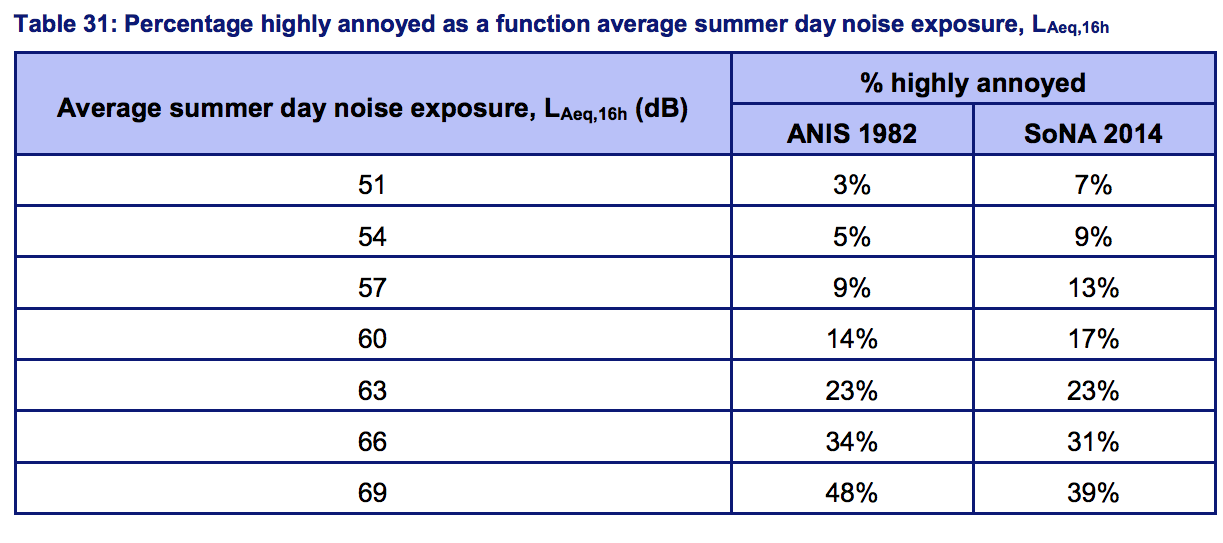
See note ***
8.17 The same percentage of respondents said by ANIS to be highly annoyed at 57 dB LAeq,16h now occurs at 54 dB. Comparing with the results in Table 31, the ‘Miedema’ dose response function, (1 Miedema & Oudshoorn (2001). Miedema H M E & Oudshoorn C G M, “Annoyance from Transportation Noise: Relationships with Exposure Metrics DNL and DENL and Their Confidence Intervals”, Environmental Health Perspectives, Volume 109, Number 4, April 2001.) predicts 12% highly annoyed at 54 dB and 16% at 57 dB.
How do measures of health and well-being relate to exposure?
8.18 Noise exposure and reported annoyance were compared against self-reported health rating (5 point scale) and the Short Warwick-Edinburgh Mental Wellbeing Scale (SWEMWBS), a measure of well-being. Poorer health ratings and lower SWEMWBS scores were found to be associated annoyance, but not with noise exposure.
What non-acoustical factors seem to influence annoyance?
8.19 Evidence was found that non-acoustic factors such as noise sensitivity, approximated social grade, and expectations – both prior to moving to an area exposed to aircraft noise and in the future – influence reported aircraft noise annoyance and these non-acoustic factors may be as important as the noise exposure level.
8.20 From the survey as a whole, 9% of respondents were estimated to be highly annoyed at an exposure level of 54 dB LAeq,16h. For the most sensitive individual the likelihood of being highly annoyed rises to 25%, the same as would occur at 64dB and for the least sensitive it reduces to 3%. For the most sensitive and those expecting more noise next summer, at 54 dB, 49% are estimated to be highly annoyed, whereas for the most
sensitive expecting less noise next summer the likelihood falls back to
9%.
8.21 An indication was found that urban/rural classification may be a non-acoustic
factor, however, this was confounded by approximated social grade and the presence of double-glazing.
Recommendations for future surveys
8.22 The survey format has been designed for more frequent use. Noting the importance of non-acoustic factors identified that may be subject to greater variation over time, it is recommended that future surveys be undertaken more frequently.
Taken from
http://publicapps.caa.co.uk/docs/33/CAP%201506%20FEB17.pdf
.
*** There is the anomaly that those living in the very noisiest areas do not show annoyance. This could be because these areas are close to the airport, and it is obviously a noisy area. Only those who have no choice, or who have decided they are not troubled by the noise, will live there. In the less noisy areas, people are not expecting high levels of noise, and are not so near the runway.
.