Air Freight
See also
Air freight is not quite the same as air cargo, which also includes mail.
IATA Air Freight Monthly Analysis
IATA produces monthly air freight figures for the global industry. Some recent examples:
Air Freight Monthly Analysis – Apr 2019
29 May 2019
Air Freight Monthly Analysis – Jul 2019
5 September 2019
Air Freight Monthly Analysis – Aug 2019
9 October 2019
CAA produces airport statistics
Monthly and annually for all UK airports. CAA airport data
| 2008 | 2018 | % change 2008 to 2018 | |
| HEATHROW | 1,397,054 | 1,699,663 | 22.60% |
| EAST MIDLANDS INTERNATIONAL | 261,507 | 334,536 | 27.90% |
| STANSTED | 197,738 | 226,128 | 14.50% |
| MANCHESTER | 141,781 | 114,131 | -19.50% |
| GATWICK | 107,702 | 112,600 | 4.50% |
| BIRMINGHAM | 12,192 | 33,709 | |
| BELFAST INTERNATIONAL | 36,115 | 27,672 | |
| LUTON | 40,518 | 26,193 | |
| EDINBURGH | 12,418 | 20,316 | |
| GLASGOW | 3,546 | 15,466 | |
| PRESTWICK | 22,966 | 13,003 | |
| DONCASTER SHEFFIELD | 1,350 | 7,107 | |
| ABERDEEN | 4,006 | 5,706 | |
| NEWCASTLE | 1,938 | 5,524 | |
| CARDIFF WALES | 1,334 | 1,459 | |
| JERSEY | 4,332 | 1,041 | |
| GUERNSEY | 3,309 | 937 | |
| SCATSTA | 723 | 449 | |
| SUMBURGH | 144 | 333 | |
| ISLAY | 275 | 283 | |
| SOUTHAMPTON | 264 | 233 | |
| BELFAST CITY (GEORGE BEST) | 168 | 227 | |
| NORWICH | 239 | 220 | |
| STORNOWAY | 551 | 217 | |
| LIVERPOOL (JOHN LENNON) | 3,740 | 159 | |
| ISLE OF MAN | 595 | 150 | |
| HUMBERSIDE | 168 | 121 | |
| ALDERNEY | 323 | 95 | |
| ISLES OF SCILLY (ST.MARYS) | 180 | 74 | |
| LANDS END (ST JUST) | 18 | 65 | |
| KIRKWALL | 106 | 38 | |
| BENBECULA | 235 | 24 | |
| TIREE | 23 | 21 | |
| BARRA | 34 | 13 | |
| BRISTOL | 3 | 7 | |
| LONDON CITY | – | 7 | |
| LEEDS BRADFORD | 334 | 3 | |
| NEWQUAY | – | 3 | |
| OXFORD (KIDLINGTON) | – | 1 | |
| DURHAM TEES VALLEY | 290 | 1 | |
| CAMPBELTOWN | 1 | 0 | |
| EXETER | 47 | 0 | |
| INVERNESS | 526 | 0 | |
| BOURNEMOUTH | 17 | 0 | |
| SOUTHEND | 16 | – | |
| BLACKPOOL | 47 | – | |
| CAMBRIDGE | 18 | – | |
| COVENTRY | 5,921 | – | |
| ISLES OF SCILLY (TRESCO) | 38 | – | |
| MANSTON (KENT INT) | 25,673 | – | |
| PENZANCE HELIPORT | 190 | – | |
| WICK JOHN O GROATS | 2 | – | |
| Total UK reporting airports | 2,282,153 | 2,645,710 | 11.60% |
Freight. Tonnes Source – CAA data
| Airport | 2006 | 2015 | 2016 | % change in 2016 | |
| HEATHROW | 1,263,128.9 | 1,496,537.4 | 1,541,028.7 | 3 | |
| EAST MIDLANDS INTERNAT | 272,302.9 | 291,688.6 | 300,101.2 | 3 | |
| STANSTED | 224,312.2 | 207,996.4 | 223,202.8 | 7 | |
| MANCHESTER | 148,957.4 | 100,020.7 | 109,630.2 | 10 | |
| GATWICK | 211,856.8 | 73,371.1 | 79,587.9 | 9 | |
| BIRMINGHAM | 14,681.0 | 7,163.8 | 30,009.7 | 319 | |
| LUTON | 17992.9 | 28007.8 | 25425.7 | -9 | |
| EDINBURGH | 36388.8 | 19322.0 | 20368.9 | 5 | |
| GLASGOW | 6288.7 | 13192.8 | 12920.7 | -2 | |
| PRESTWICK | 28536.7 | 11241.6 | 10821.9 | -4 | |
| DONCASTER SHEFFIELD | 167.2 | 3201.1 | 9340.8 | 192 | |
| BELFAST INTERNATIONAL | 38416.7 | 30388.7 | 7597.4 | -75 | |
| ABERDEEN | 4021.6 | 6545.5 | 5730.8 | -12 | |
| NEWCASTLE | 306.3 | 3717.1 | 4574.4 | 23 | |
| COVENTRY | 7785.4 | 2258.5 | 2031.6 | -10 | |
| Total London area airports | 1,717,360 | 1,805,941 | 1,869,314 | 4 | 78.4% of UK total |
| Total All Reporting UK Airports | 2314546.0 | 2299328.0 | 2385231.0 | 4.0 | |
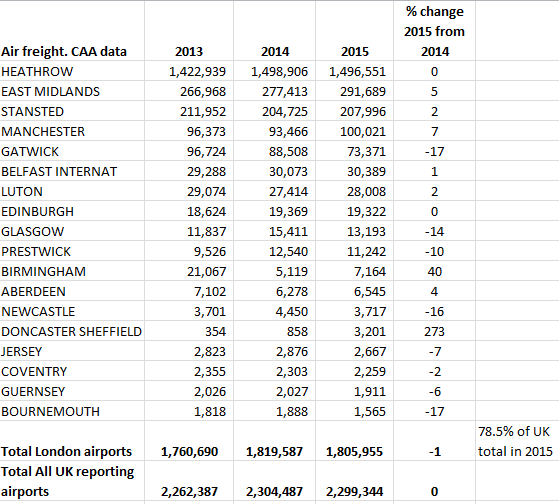
The CAA data from 2015:

the other UK airports deal with under 1,000 tonnes of air freight per year.
See CAA Table 13.2 Air freight 2005 to 2015
for all the freight data for all UK airports every year from 2005 to 2015
Heathrow air freight in recent years:
| 2002 | 2007 | 2008 | 2009 | 2010 | 2011 | 2012 | 2013 |
| 1,234,940 | 1,310,987 | 1,397,054 | 1,277,650 | 1,472,988 | 1,484,351 | 1,464,390 | 1,422,939 |
| 2014 | 2015 | |||||
| 1 498 906 | 1 496 551 |
UK Air Freight tonnage – CAA data
| Year | 2003 | 2004 | 2005 | 2006 | 2007 | |
| London Airports | 1,667,803 | 1,795,326 | 1,788,671 | 1,717,360 | 1,724,040 | |
| All UK reporting airports | 2,205,934 | 2,368,601 | 2,360,984 | 2,314,547 | 2,325,239 | |
| 75.6% London in 2003 | ||||||
| Year | 2008 | 2009 | 2010 | 2011 | 2012 | |
| London Airports | 1,743,028 | 1,563,783 | 1,808,005 | 1,802,939 | 1,805,761 | |
| All UK reporting airports | 2,282,153 | 2,047,861 | 2,324,822 | 2,297,602 | 2,302,329 | |
| 77.8% London in 2013 |
| Year | 2013 | 2014 | 2015 | |
| London airports | 1,760,690 | 1,819,587 | 1,805,955 | |
| All UK reporting airports | 2,262,387 | 2,304,487 | 2,299,344 |
Total 2013
from RCD Aviation

.
Air Freight
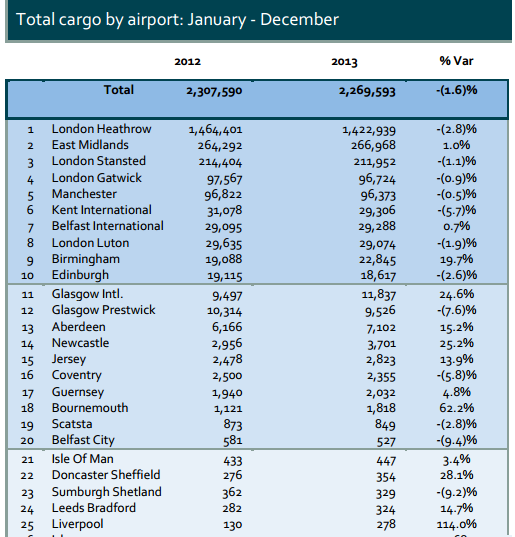
CAA data showing air freight at all UK airports 2002 to 2012
http://www.caa.co.uk/docs/80/airport_data/2012Annual/Table_13_2_Freight_2002_2012.pdf
(Tonnes)
Excerpt showing just the largest airports, by air freight, for some of the years:
| Airport (air freight in tonnes) | 2002 | 2007 | 2008 | 2009 | 2010 | 2011 | 2012 | % change 2012 cf. 2011 |
| HEATHROW | 1,234,940 | 1,310,987 | 1,397,054 | 1,277,650 | 1,472,988 | 1,484,351 | 1,464,390 | -1 |
| EAST MIDLANDS | 219,252 | 274,753 | 261,507 | 255,121 | 273,669 | 264,595 | 264,292 | 0 |
| STANSTED | 184,449 | 203,747 | 197,738 | 182,810 | 202,238 | 202,593 | 214,160 | 6 |
| GATWICK | 242,519 | 171,078 | 107,702 | 74,680 | 104,032 | 88,085 | 97,567 | 11 |
| MANCHESTER | 113,279 | 165,366 | 141,781 | 102,543 | 115,922 | 107,415 | 96,822 | -10 |
| MANSTON | 32,240 | 28,371 | 25,673 | 30,038 | 28,103 | 27,495 | 31,078 | 13 |
| LUTON | 20,459 | 38,095 | 40,518 | 28,643 | 28,743 | 27,905 | 29,635 | 6 |
| BELFAST INTERNAT | 29,474 | 38,429 | 36,115 | 29,804 | 29,716 | 31,062 | 29,095 | -6 |
| EDINBURGH | 21,232 | 19,292 | 12,418 | 23,791 | 20,357 | 19,332 | 19,115 | -1 |
| BIRMINGHAM | 13,326 | 13,585 | 12,192 | 13,070 | 21,605 | 16,626 | 19,088 | 15 |
| PRESTWICK | 39,500 | 31,517 | 22,966 | 13,385 | 12,163 | 11,846 | 10,314 | -13 |
| GLASGOW | 5,041 | 4,276 | 3,546 | 2,334 | 2,914 | 2,430 | 9,497 | 291 |
| ABERDEEN | 3,808 | 3,434 | 4,006 | 3,822 | 4,211 | 5,311 | 6,166 | 16 |
| NEWCASTLE | 1,437 | 785 | 1,938 | 2,597 | 3,650 | 3,059 | 2,956 | -3 |
| COVENTRY | 4,673 | 7,469 | 5,921 | 2,440 | – | 564 | 2,500 | 343 |
| JERSEY | 5,543 | 4,416 | 4,332 | 3,672 | 3,027 | 2,634 | 2,478 | -6 |
| GUERNSEY | 4,445 | 3,420 | 3,309 | 2,901 | 2,132 | 2,194 | 1,940 | -12 |
| BOURNEMOUTH | 5,683 | 253 | 17 | 4 | 304 | 0 | 1,121 | 0 |
| SCATSTA | 676 | 765 | 723 | 752 | 765 | 808 | 873 | 8 |
| HUMBERSIDE | 126 | 144 | 168 | 241 | 600 | 1,132 | 621 | -45 |
| BELFAST CITY | 1,058 | 1,057 | 168 | 138 | 155 | 457 | 581 | 27 |
| ISLE OF MAN | 2,178 | 533 | 595 | 500 | 404 | 424 | 433 | 2 |
| SUMBURGH | 98 | 104 | 144 | 53 | 268 | 315 | 362 | 15 |
| SOUTHAMPTON | 382 | 297 | 264 | 209 | 116 | 132 | 359 | 172 |
| LEEDS BRADFORD | 114 | 109 | 334 | 359 | 235 | 194 | 282 | 45 |
| DONCASTER SHEFFIELD | – | 1,602 | 1,350 | 344 | 216 | 102 | 276 | 171 |
| NORWICH | 92 | 188 | 239 | 339 | 266 | 330 | 213 | -35 |
| ISLAY | 191 | 272 | 275 | 229 | 213 | 209 | 168 | -20 |
| ALDERNEY | 449 | 290 | 323 | 275 | 216 | 182 | 161 | -12 |
| STORNOWAY | 767 | 558 | 551 | 475 | 192 | 115 | 154 | 34 |
| Total for all reporting UK airports | 2,193,255 | 2,325,239 | 2,282,153 | 2,047,861 | 2,324,822 | 2,297,602 | 2,302,329 | 0 |
| 2002 | 2007 | 2008 | 2009 | 2010 | 2011 | 2012 |
.
CAA data. Total All Reporting UK Airports. Air freight. (Tonnes)
2001 2,143,281
2002 2,193,255
2003 2,205,934
2004 2,368,601
2005 2,360,984
2006 2,314,547
2007 2,325,239
2008 2,282,153
2009 2,047,861
2010 2,324,822
2011 2,297,602 down -1% compared to 2010
2012 2,302,329 almost no change compared to 2011
http://www.caa.co.uk/docs/80/airport_data/2011Annual/Table_13_2_Freight_2001_2011.pdf
http://www.caa.co.uk/docs/80/airport_data/2012Annual/Table_13_2_Freight_2002_2012.pdf
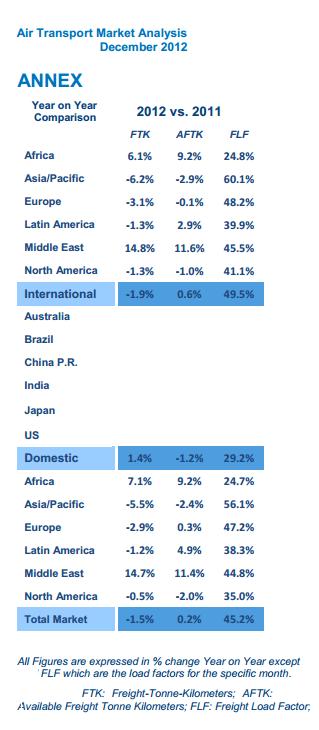
Global air freight in 2012 (IATA data)
http://www.iata.org/whatwedo/Documents/economics/MIS_Note_Dec12.pdf
.
AirportWatch report on air freight
“Air Freight: The Impacts” Air freight pays no tax on aviation fuel. It is exempt from VAT. And it does not pay the equivalent of Air Passenger Duty. 10.12.2009 More …..

Full report “Air Freight: the Impacts” full report (pdf) 38 pages
5 page summary “Air Freight: the Impacts” Summary
Airport-by-airport analysis Airport by Airport analysis 15 pages
Sources of information on air freight
Civil Aviation Authority statistics
(Air Freight is Table 13 each month)
Trade press sources:
International Freighting Weekly
AEA (Association of European Airlines)
World’s busiest airports by cargo traffic (Wikipedia)
(2009)
1. Memphis (3,697,054 metric tonnes) 2. Hong Kong 3. Shanghai 4. Seoul
5. Paris Charles de Gaulle 6. Anchorage 7. Louisville 8. Dubai 9. Frankfurt 10. Narita 11. Singapore 12. Miami 13. Los Angeles 14. Beijing
15. Taiwan 16. Heathrow (1,349,571 tonnes) 17. Amsterdam 18. JFK New York 19. Chicago 20. Bangkok
Mail sent by air freight
The CAA provides data – each year
CAA airport statistics
Table 16 1: Mail by Type and Nat of Operator
Table 16 2: Mail (past 10 years)
Table 17: Intl and Domestic Mail
Table 18: Mail by Acft Configuration
eg. Table 16 2 Mail 2000 2010 and
‘Table 16 2 Mail 2002 2012.pdf’
see also CAA Figures for mail during 2007, 2008, 2009 and 2010
for the 10 UK airports with the most mail.
UK Air freight tonnage month by month,
compared to equivalent month a year earlier (CAA figures) see link ……
See also BAA airports data, month by month. BAA release the figures for their airports, around the middle of each month, at BAA press releases
Recent BAA monthly figures have been put together, for ease of access, at
BAA monthly freight data.
Air freight in the UK in recent years
Air freight in the UK in 2010
These were the top 11 airports for air freight. (tonnes) (CAA figures)
Airport Name 2010 tonnes % change from 2009
HEATHROW 1,472,988 +15
EAST MIDLANDS 273,669 + 7
STANSTED 202,238 + 11
MANCHESTER 115,922 +13
GATWICK 104,032 +39
BELFAST INTERNATIONAL 29,716 0
LUTON 28,743 0
MANSTON (KENT INT) 28,103 – 6
BIRMINGHAM 21,605 + 65
EDINBURGH 20,357 -14
PRESTWICK 12,163 – 9
Total of all reporting UK airports in 2008 = 2,324,822 tonnes – (+ 14% more than in 2009)
CAA freight statistics 2010 Freight 2000 – 2010
Air freight in the UK in 2009
These were the top 11 airports for air freight. (tonnes) (CAA figures)
Airport Name 2009 tonnes % change from 2008
HEATHROW 1,277,649 – 9
EAST MIDLANDS 255,120 – 2
STANSTED 182,810 – 8
MANCHESTER 102,543 – 28
GATWICK 74,679 – 31
KENT INTERNATIONAL 30,037 +17
BELFAST INTERNATIONAL 29,803 -17
LUTON 28,643. – 29
EDINBURGH 23,79. + 92
PRESTWICK 13,385 – 42
BIRMINGHAM 13,069 + 7
Total of all reporting UK airports in 2009 = 2,047,861 tonnes – ( – 10% less than in 2008)
CAA freight statistics 2009 Freight 1999 – 2009
Air freight in the UK in 2008
These were the top 11 airports for air freight. (tonnes) (CAA figures)
Airport Name 2008 tonnes % change from 2007
HEATHROW 1397053.818 + 7%
EAST MIDLANDS 261506.671 – 5
STANSTED 197738.177 – 3
MANCHESTER 141780.692 – 14
GATWICK 107702.029 – 37
LUTON 40517.9 + 6
BELFAST INTERNAT 36114.583 – 6
KENT INTERNAT 25673.281 – 10
PRESTWICK 22965.994 – 27
EDINBURGH 12417.769 – 36
BIRMINGHAM 12191.896 – 10
Total of all reporting UK airports in 2008 = 2,282,153 tonnes – (2% less than in 2007)
CAA freight statistics 2008 Freight 1998 – 2008
see also BAA airports freight data for all of 2008 – see BAA press release
Air Freight in the UK in 2007
These were the top 12 airports for air freight. (tonnes) (CAA figures)
1 Heathrow 1,310,987
2 N’ham East Midlands 274,753
3 Stansted 203,747
4 Gatwick 171,078
5 Manchester 165,368
6 Belfast International 38,429
7 Luton 38,095
8 Prestwick 31,517
9 Kent 28,371
10 Edinburgh 19,292
11 Birmingham 13,585
12 Coventry 7,469
Total of all reporting UK airports in 2007 = 2,325,772 tonnes – (no increase on 2006)
CAA freight statistics 2007
Air Freight in the UK in 2006
These were the top 10 airports for air freight. (tonnes)
(CAA figures)
1 Heathrow 1,263,129
2 N’ham East Midlands 272,303
3 Stansted 224,312
4 Gatwick 211,857
5 Manchester 148,957
6 Belfast International 38,417
7 Edinburgh 35,389
8 Prestwick 28,537
9 Kent 20,841
10 Luton 17,993
11 Birmingham 14,681
12 Coventry 7,785
Total of all UK reporting airports in 2006 = 2,315,445 tonnes
(a 2% increase on 2005)
Freight (tonnes) in 2002 (CAA figures)
1 Heathrow 1,234,940
2 Gatwick 242,519
3 N’ham East Midlands 219,252
4 Stansted 184,449
5 Manchester 113,279
6 Prestwick 39,500
7 Kent International 32,240
8 Belfast International 29,274
9 Edinburgh 21,232
10 Luton 20,459
Total of all UK reporting airports in 2002 = 2,195,433 tonnes
DfT produces analysis of the end-to-end journey of UK air freight
12.5.2009 The DfT has published its end to end analysis for air freight in the UK. I t is a 56 page document, containing a great deal of information about air freight in the UK, over past decades, and projections into the future. The document focuses mainly on Heathrow – the largest cargo airport in the UK, and East Midlands, which has the most express courier services. The UK imports (57%) more air freight than it exports (43%) by weight. This adds up to over 1,280,000 tonnes of imports (1,230,000 tonnes excluding domestic air freight) and 960,000 tonnes of exports. The primary routes for air freight in and out of the UK are the transatlantic routes to and from the United States for both imports and exports, and also routes bringing imports from the major Asian economies. There is a lot of detail. More …..
Air Freighter accidents
Unfortunately, being older aircraft and with less attention to safety in some countries, there are far more accidents to frieght aircraft that to passenger aircraft. More …..

