The Problems
 @AirportWatch . AirportWatch on Facebook
 ![]()
| The main problems caused by aviation, as we see it can be summed up as: | |
Climate Change | Noise |
Tourism deficit | Government policy |
Employment | Key facts and figuresHow many flights per year, how many planes, etc – lots of data |
Biofuels | |
Love Miles“I’m trying hard to be eco-friendly. But please don’t ask me to give up flying to visit my family” | |
VAT and Fuel DutyAir travel is zero rated for VAT and pays no fuel duty. | |
All these points are backed by mainstream research – read more in our Briefings and Information section.
How many people are flying every year, worldwide?
IATA says the number of scheduled air passengers rose from 3,145,000,000 in 2013 to 4,579,000,000 (= 4.58 billion) anticipated in 2019. ie. a rise of 46%.
IATA said 2.5 billion flew in 2009.
IATA says the US has the most originating international air passengers with UK, Germany, Spain and France next. It says international passengers worldwide were 952 million in 2009 and domestic passengers were 1.5 billion in 2009. IATA said (Feb 2011) they want to ” handle 16 billion passengers and 400 million tonnes of freight” by 2050.
There are around 800 million air passengers annually in Europe. And around 222 million in the UK (2011 figure, excluding transit).
IATA said (June 2012 link that in 2011, aviation transported some 2.8 billion passengers (and 48 million tons of cargo).
See also World Bank data on the number of air passengers, country by country, 2002 – 2010.
ATAG says in 2012 there were “over 3 billion” passengers, but it gives no source. http://atag.org/facts-and-figures.html
How much carbon does the global aviation industry emit?
IATA says the amount of jet fuel consumed was 74 billion gallons in 2013 and 97 billion gallons anticipated in 2019. ie. it rose by 31%.
IATA says the CO2 emissions of the global airline industry were were 710 million tonnes in 2013, and 915 million tonnes anticipated in 2019. ie. they rose by 30.6%. [ see link ]
IATA says the airline industry emitted 669 million tonnes CO2 in 2012. [674 million tonnes in 2013 – up 2.6% on 2012]. [ IATA figures produced in 2019 say the CO2 figure was 710 million tonnes in 2013. See link ]
IATA says 649 million tonnes CO2 in 2010 (compared with 627million tonnes in 2009).
(529 million tonnes in 2004, about 630 m in 2005 and 679 m in 2006). About a 10 – 11% increase in CO2 emissions between 2005 and 2010.
IATA says: “Total climate change impact (including radiative forcing from other greenhouse gases) is 3%, and projected to grow to 5% by 2050 (IPCC)”.
http://www.iata.org/pressroom/facts_figures/fact_sheets/Pages/environment.aspx
globally aviation is responsible for:
- 669 million tonnes of carbon dioxide (CO2) emissions (2011) – compared to 34 billion tonnes of CO2 (2011) from human activities globally [IATA says 689 million tonnes in 2012]. In 2012 global CO2 emissions rose to 35.6 billion tonnes – according to figures from the Global Carbon Project, link ]
- 2% of “human-induced” global CO2 emissions
- 12% of CO2 emissions from all transport sources, compared to 74% from road transport
- 3% of the total man-made contribution to climate change
ATAG said (? for 2011) : “If aviation were a country, it would rank 19th in the world in terms of gross domestic product (GDP), generating $539 billion of GDP per year, considerably larger than some members of the G20 (and around the same size as Switzerland). [Compared to its position as the 7th largest CO2 emitter – see below].
.
From ATAG for 2015
http://www.atag.org/facts-and-figures.html
Worldwide, flights produced 770 million tonnes of CO2 in 2015. [Figure for international aviation, not including domestic, was 492,000 tonnes in 2013].
The aviation industry consumes around 1.5 billion barrels of Jet-A1 fuel annually. Aviation is responsible for 12% of carbon emissions from all transport sources, compared to 74% from road transport.
If aviation were a country, it would rank 21st in the world in terms of gross domestic product (GDP), generating $664 billion of GDP per year (in 2015), (around the same size as Switzerland).
Check details against https://en.wikipedia.org/wiki/List_of_countries_by_GDP_(nominal)
If aviation were a country, it would rank about 13th in the world, in terms of its carbon emissions. That is about the same (in 2013) as Saudi Arabia.
Check details against
https://en.wikipedia.org/wiki/List_of_countries_by_carbon_dioxide_emissions
In 2013 the ranking of countries by carbon emissions was (Wikipedia):
1. China 10,540,000
2. United States 5,334,000
3. European Union 3,415,000
4. India 2,341,000
5. Russia 1,766,000
6. Japan 1,278,000
7. Germany 767,000
8. International Shipping 624,000 –
9. Iran 618,000
10. South Korea 610,000
11. Canada 565,000
12. Brazil 501,000
13. Saudi Arabia 494,000 1
14. International Aviation 492,000 –
https://en.wikipedia.org/wiki/List_of_countries_by_carbon_dioxide_emissions
=====
Figures from ATAG show there were 649 million tonnes of CO2 emitted by airlines worldwide in 2010. link
In 2011 it was 676 million tonnes.
Then 770 million tonnes in 2015.
That’s 18.6% higher in 2015 than in 2010.
And 14% higher carbon emissions in 2015 than in 2011, in that time global aviation went from equivalent to the 19th biggest country by GDP to being the 21st biggest.
.
See also Climate change effect of the carbon dioxide emissions, and other gases emitted at altitude
 http://www.indexmundi.com/energy.aspx?product=jet-fuel
and growth rate of jet fuel use per year
http://www.indexmundi.com/energy.aspx?product=jet-fuel&graph=consumption-growth-rate
Global [aviation] CO2 output grew to 674 million tonnes in 2013 up 2.6% – clearly new technology is yet to impact emissions, and the IATA goal of 1.5% fuel efficiency to 2020 is currently off track. http://www.aviationeconomics.com/NewsItem.aspx?title=RDC,-Aviation-Economics-and-the-World-of-Air-Transport
How much jet fuel is burned each year by the global aviation industry?
Aviation accounts for 12% of the fuel consumed by the entire transportation sector, which is equivalent to roughly 1.5 to 1.7 billion barrels of kerosene jet fuel annually (about 70 billion gallons). A barrel of oil is 42 US gallons (34.97 imperial gallons or 158.98 litres) http://biomasshub.com/knowledge-center/topic-guides/aviation-biofuels/
There can be 6 to 8 barrels of oil in a ton, depending on density. For example: 256 US gallons [6.1 bbl – oil barrels] of heavy distillate per ton, 272 gallons [6.5 bbl – oil barrels] of crude oil per ton, and 333 gallons [7.9 bbl] of gasoline per ton. link
So presuming 7 barrels of oil in a ton, and aviation is using some 1.7 billion barrels of kerosene per year, that is around 11.9 or 12 billion tons.
A barrel of crude oil is about 42 US gallons and depending on the grade of oil, can make about 19 US gallons of gasoline, 10 gallons of diesel, 4 gallons of jet fuel [ie. that is 9.5% of the barrel that can be made into jet kerosene] and another 9 gallons of other oil products such as liquid petroleum gas, plastics, lubricants or heating oil. So it takes about 10 barrels of crude oil to produce one barrel of jet fuel.
[Analysts project that aviation biofuels may replace roughly 1% of kerosene by 2015, 25% by 2025, and 30% by 2030. The CCC expects biofuel may replace 10% of UK jet fuel by 2050. So if the industry just got 5% of its current fuel demand from biofuel, that would require 3.5 billion gallons per year. Wikipedia says in 2010 world biofuel production – all biofuels, not only biodiesel – was 28 billion gallons US, of which 82% was bioethanol, of no use in aircraft. Only about 5 billion gallons of biodiesel were produced worldwide in 2010, much of it from palm oil. http://en.wikipedia.org/wiki/Biofuel The 28 billion gallons provided 2.7% of the world’s fuels for road transport ].
Jet A Fuel produces about 9.57 kg CO2 / gallon of fuel burned. Which is about 2.5 kg CO2 per litre.
[If the global aviation industry produced 649 million tonnes of CO2 in 2010 – see above – this equates to around 70 billion gallons, as 649m / 9.57 = approx 68 billion].
.
How do global aviation emissions compare with emissions by large countries? It comes 7th.
Aviation emissions, worldwide (2009) were 7th compared to whole countries, after China, USA, India, Russia, Japan and Germany. Then global aviation.

http://blogs.edf.org/climatetalks/files/2012/07/Aviation-CO2-Ranking.jpg
http://www.edf.org/sites/default/files/petsonk-transcript-07232012.pdf
Sources: International Civil Aviation Organization, International Energy Agency, United Nations Environment Programme)
.
How many commercial planes are there in the world?
Difficult to get an accurate figure, but perhaps in the region of 34,000 in 2011. Boeing said (July 2012) that it hoped to sell 34,000 planes by 2032, and so double the number. ie. it expects 60.000 odd by 2030? It also said that it expects the world freighter fleet to nearly double from 1,740 aircraft currently in 2012, to 3,200 in 20 years’ time. http://www.airportwatch.org.uk/?p=2530
.
What proportion of UK citizens fly in any one year?
Around 50% – or 47% in 2010
In 2008 the Department for Transport publication, “Public experiences and attitudes to air travel” said “The survey indicates that 51% of adults had not flown in the last 12 months. This corresponds with the results of the 2002 Omnibus Survey, where 51% of adults had not flown in 2001. However, as the report notes, although the proportion of the population who have flown in the past year is the same in both surveys, in the more recent survey a higher proportion of air travellers were making multiple trips. In 2006, 30% of air travellers said they had flown three or more times in the last year; in 2002 the figure was 23%.” (page 55 of link)
Also, the DfT survey ‘Public experiences of and attitudes towards air travel’. of July 2010 ( link ) showed that 47% of adults had flown in the previous 12 months (down on the 49% recorded in the 2001 survey). It states (on page 2): “Just under half (47%) of adults had flown at least once in the last 12 months; 37% had made at least one short-haul flight, 18% had made a long-haul flight and 8% had made a domestic flight within the UK. A fifth (20%) of adults had made just one flight, 11% two flights and 16% three or more flights. These proportions are similar to the 2006 and 2008 Omnibus surveys “
In 2014 the DfT’s “Public experiences of and attitudes towards air travel. 2014″ said: “Just under half (48%) of adults surveyed had flown at least once in the last 12 months and 10% had made 4 or more flights.” Outward and return flights and any transfers were counted as one trip. either within the United Kingdom or to go abroad. Short-haul flights to Europe were the most common; 37% of adults had taken a short-haul flight during the last 12 months, 18% had taken a long-haul flight and 7% had flown within the UK.
Frequency of flying increases with income and socio-economic group. Among respondents in managerial and professional occupations, 71% had made at least one flight in the last 12 months compared with 50% of those in intermediate or routine and 36% in manual occupations.

2.5 Respondents living in London or the South East were also more likely to have travelled by plane than people in the rest of the country. Over half (57%) of people in London and the South East had made at least one flight and 23% had made three or more in the last 12 months compared to 44% and 11% respectively in the rest of the country. People living in London and the South East were also more likely to have made a long-haul flight (29%) than people in the rest of Great Britain (14%) but had a similar propensity to fly within the UK.
A quarter of those who had not flown at all in the previous year said they expected to make more trips in the next year. Among those who had made three or more flights in the previous year, 14% anticipated making more flights and 20% anticipated making fewer flights in the coming year.
Respondents who expected to make more flights were asked why they believed this would be the case. The most common reason, cited by half of those that expected to make more flights, was because they wanted to go abroad more. Other reasons included changes in personal circumstances (20%) and having friends/relatives who had moved abroad (10%).
(the survey is of a bit over 1,000 adults aged 16 and over living in private households in Great Britain.)
.
How many seat kilometres do UK airlines fly each year?
(one seat kilometre is one person flying one kilometre)
| Year | Available seat kilometres(000 000) | Seat kilometres used(000 000) | % of seat km used |
| 1989 | 157,689 | 120,636 | 76.5 |
| 1990 | 164,609 | 126,092 | 76.6 |
| 1991 | 160,970 | 120,691 | 75 |
| 2000 | 338,783 | 262,069 | 77.4 |
| 2001 | 328,631 | 250,985 | 76.4 |
| 2008 | 397,675 | 314,707 | 79.1 |
| 2009 | 368,063 | 297,433 | 80.8 |
| 2010 | 354,154 | 289,320 | 81.7 |
| 2011 | 377,201 | 306,400 | 81.2 |
The increase in seat kilometres used – by UK airlines – between 1991 and 2011 was 153%. The increase was 22% between 2001 and 2011.
Data from CAA AirlineStatistics. Seat Kilometres available and used 1989 to 2011
See also Seat kilometres used by UK airlines over the past 5 years
.
What proportion of UK airport passengers are flying for business reason, compared to holidays or visiting friends and family?
In 2010, the proportion of business passengers (as compared to leisure, including visiting friends and family) was 29.9% at Heathrow, 20.4% at Gatwick, 29.5% at Manchester, 19.6% at Luton and 17.7% at Stansted. Data from the Health Protection Agency shows the proportion of business passengers has been falling steadily since 2000.
Average flight distance by UK airlines is increasing
CAA Data from 2005 CAA data from 2011
[Seat km used divided by number of passengers uplifted – so an average figure].
British Airways averaged 3,518 km per passenger (on average) in 2011 but 3,394 km in 2005.
EasyJet averaged 1,136 km per passenger in 2011 but 954 km in 2005.
[Virgin Atlantic (almost no increase) averaged 7,197 km per passenger in 2011 and 7,146 km in 2005].
Thomson Airways averaged 2.983 km per passenger in 2011 but 2,447 km by Thomson Fly in 2005.
Thomas Cook averaged 3,440 km per passenger in 2011 but 2,907 km in 2005.
BMI averaged 1,391 km per passenger in 2011 but 910 in 2005.
.
.
Which airlines have the largest number of annual revenue passenger kilometres (RPK)?

This puts Delta Airlines top, with over 300 billion passenger kilometres in 2011.
From Financial Times
.
Which are the largest airports in the world?
The world’s busiest airports 2015
1. Hartsfield–Jackson Atlanta International Airport
2. Beijing Capital International Airport
3. Dubai International Airport
4. O’Hare International Airport
5. Tokyo Haneda Airport
6. London Heathrow Airport
7. Los Angeles International Airport
8. Hong Kong International Airport
9. Paris-Charles de Gaulle Airport
10. Dallas/Fort Worth International Airport
What is ICAO doing so far to cut global aviation emissions?
International Civil Aviation Organization’s (ICAO) 2010 resolution:
“Resolves that States and relevant organizations will work through ICAO to achieve a
global annual average fuel efficiency improvement of 2% until 2020 and an aspirational global fuel efficiency improvement rate of 2% per annum from 2021 to 2050, calculated on the basis of volume of fuel used per revenue tonne kilometre performed”. (page 11) and
Also resolves that, without any attribution of specific obligations to individual States,
ICAO and its member States with relevant organizations will work together to strive to achieve a collective medium term global aspirational goal of keeping the global net carbon emissions from international aviation from 2020 at the same level, …” (page 11)
What their phrase “carbon neutral growth” from 2020 means is only that airlines can offset emissions above 2020 levels starting in 2021. No need to actually cut emissions.
The 2010 ICAO resolution itself recognizes the proposal is not enough. It says:
“the aspirational goal of 2% annual fuel efficiency improvement is unlikely to deliver the level of reduction necessary to stabilize and then reduce aviation’s absolute emissions contribution to climate change, and that goals of more ambition will need to be considered to deliver a sustainable path for aviation.”
The proposal by IATA, the aviation industry, is even weaker than the ICAO resolution, and allows emissions to continue to grow.

Above: the emissions-reductions proposal of the International Air Transport Association IATA) (green), and business-as-usual emissions (red-brown).
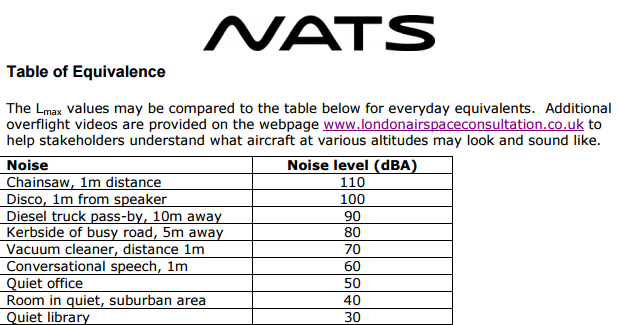
Aviation and Noise
Millions of people are disturbed by aircraft noise….and it will get worse
Figures below from the 2001 National Noise Study carried out by the Building Research Establishment (BRE) for DEFRA – the most comprehensive study of recent years.
Aircraft Noise 71% had heard it
Traffic Noise 84% ” ”
Bothered, annoyed or disturbed by it:
Aircraft Noise 20% bothered to some extent
Traffic Noise 40% ” ” ”
Neighbour/neighbourhood Noise 37% ” ” “
Neighbour/neighbourhood Noise 19% ” ” ”
Neighbour/neighbourhood Noise 2% ” ” ”
Individual planes have become considerably quieter since the 1970s but this has been off-set by the huge growth in aircraft numbers – causing more noise in total.
What legal controls are there on aircraft noise in the UK?
None.
Aircraft noise is considered to be outside the law, in terms of noise nuisance. This stems the Civil Aviation Act 1949 [ie. a very out of date law]
1949 c. 67 Part IV Section 40
This states:
Liability of aircraft in respect of trespass, nuisance and surface damage
“(1). No action shall lie in respect of trespass or in respect of nuisance, by reason only of the flight of an aircraft over any property at a height above the ground, which, having regard to wind, weather and all the circumstances of the case is reasonable, or the ordinary incidents of such flight so long as the provisions of Part II and this Part of this Act and any Order in Council or order made under Part II or this Part of this Act are duly complied with.”
http://www.legislation.gov.uk/ukpga/1949/67/section/40/enacted
By contrast, car horns cannot be sounded in residential areas after 11.30pm, by law; ice cream vans cannot sound their chimes before 12 noon or after 7pm; noisy fireworks cannot be set off by unauthorised persons between 11pm and 7am; and if your local council has resolved to apply the provisions of the Noise Act 1996 (in England, Wales or Northern Ireland), it must take reasonable steps to investigate complaints of noise from dwellings or licensed premises between 11pm and 7am.
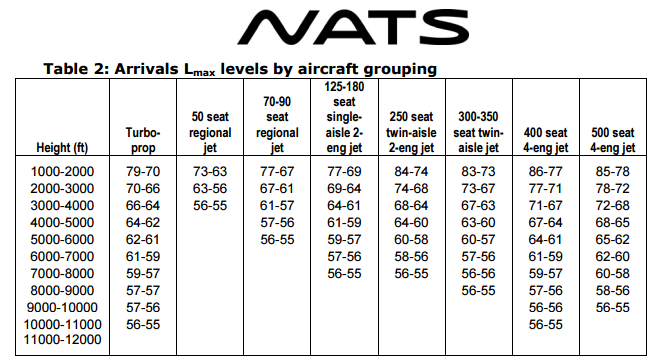
Have planes actually become quieter in the past few years, and are A380s quieter than 747s?
Figures from NATS below:

ARRIVALS
DEPARTURES

.
More information on noise claims by the A380 and the Boeing 787 here
http://www.airportwatch.org.uk/2013/07/musicians-look-to-clean-up-their-acts/
The type of engine is also important.
Airbus said: “Airbus’ 21st century flagship A380 is the quietest long-haul aircraft flying today, generating 50% less noise on departure than its nearest competitor – all while carrying 40% more passengers.” Link
And Heathrow said: “Heathrow has played a key role in enabling local residents to share in the reductions in aircraft noise that the A380 delivers. Following input from key airlines operating at Heathrow, the A380 was specifically designed to meet one of the quietest noise categories. Because airlines value the ability to operate at Heathrow during the day and night, and Heathrow’s standards are directly driving the development of quieter aircraft.
“The A380 generates at least 50 per cent less noise than its nearest competitor at take-off and on landing, the A380 meets the most stringent noise rules at any international airport, namely London’s Heathrow airport – QC2 for departures and QC0.5 for arrivals. This is of major benefit both to A380 operators who have more flexibility to operate night-time flights, and to airports, since passenger capacity will be increased while limiting the impact of noise on the surrounding communities.” Airbus ” Link
Also on the Boeing 787 http://www.airportwatch.org.uk/2012/05/dreamliner/
Also briefings at Noise Briefings
| Details on Airports with Noise and Emissions RestrictionsBoeing data on airports around the world, including most UK commercial airportshttp://www.boeing.com/commercial/noise/list.html There is a data sheet for each airport with a lot of detail————————————————————————————DEFRA MapsDEFRA produce rough maps showing the main noise contours around UK airports. Detailsfor example, the map for London City AirportThey also give estimates of the number of people affected by noise (click on Noise Exposure Charts) |
Complaining about noisy and off-track aircraft:
If you have complaints about noise, or of planes away from set flight paths, you can complain to your local airport management (check who is the appropriate manager to write to).
Send a copy to the DfT: Aviation Environmental Policy, Department for Transport, Great Minster House, 76 Marsham Street, London, SW1P 4DR
Aviation and Climate Change

This shows global CO2 levels, month by month, from Mauna Loa. Details http://co2now.org/
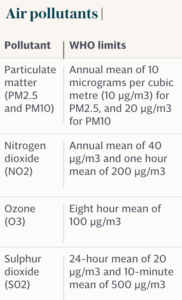
Air Quality at and Around Airports
Air pollution is a major issue for those who live in the vicinity of large airports. EU legal limits came into place in 2010 but that they are being breached, especially round Heathrow. The Environmental Audit Committee published a pretty damning report earlier in November 2011. Details. It may also be that limits are being breached around London City Airport.
Emissions from aircraft, air-side support vehicles and airport related traffic all contribute to a build up of potentially harmful gases such as oxides of nitrogen, carbon monoxide, VOCs (volatile organic compounds) and ozone. They also produce small particulates.
The most important pollutants are usually nitrogen dioxide (NO2) and small particulates (PM10, PM2.5). These often breach standards set by the UK government and the EU to protect human health.
Blight and quality of life
“How and airport can damage a local community” gives a personal perspective.
Stop Stansted Expansion produced a response, presented to Uttlesford District Council in August 2006, about the very severe impacts which the airport’s operations were already having on the community and on the lives of the people who live there, as a result of growth at the airport. It describes stress, anxiety, noise pollution, light pollution, traffic problems and breakdown in community life.
Erosion of the Community – from the SSE website
Aviation and the economy
“Surely we need flying for the economy?”
Tourism Deficit
There is a “tourism deficit” to the UK economy – estimated at around £ 13 – 20 billion per year over the past decade. This is the difference in spending (other than on travel tickets*) between money spent by visitors to the UK, and the money spent by Brits travelling abroad.
Every year, a great deal more money is spent by UK residents travelling abroad, than by foreign visitors coming here.
The component of the tourism deficit from trips made by air travel is a large part of it. For instance, in 2010 the air travel component was £12.4 billion our of a total tourism deficit (including ship and Channel Tunnel) of £14.2 billion.
In 2011, the air travel component was £11.2 billion, out of the total of £13.1 billion.
.
Below are recent Tourism Deficit figures from the ONS, from their Overseas Travel and Tourism reports.
2004 £17.2 billion
2005 £ 17.9 billion
2007 £19.05 billion
2008 £20.52 billion
2009 £15.10 billion
2010 £14.21 billion link (but ONS says £14.9 billion – link Page 5)
- UK residents spent £45.4 billion on visits overseas in 2018, which was 1% more than in 2017.
- Overseas residents spent £22.9 billion on visits to the UK in 2018, a decrease of 7% compared with 2017.
| The UK’s travel deficit 2015 | ||
|---|---|---|
| UK visits abroad | Foreign visits to UK | |
| Number of trips | 65.7m (+ 9.4% v. 2014) | 36.1m (+5.1%) |
| Spend (not adjusted for inflation) | £39bn (+9.8%) | £22.1bn (+1%) |
| source: ONS | ||
Total spending of all trips by UK residents abroad – £ millions
2019 – £62,325
Spending by UK residents travelling abroad by air
2019 – £54,976 which was 88.21% by air
Spending by Overseas visitors’ trips to the UK in 2019.
£28,228 – by all travel modes
£24,933 – by air (air is 88%)
Data from Table 3.9 at https://www.ons.gov.uk/peoplepopulationandcommunity/leisureandtourism/datasets/ukresidentsvisitsabroad
.
ONS data

| 5 | Earnings in the UK and expenditure abroad by month | ||||||
| £ million | |||||||
| Overseas residents’ | Uk residents’ | ||||||
| visits to the UK | visits abroad | ||||||
| Earnings | Expenditure | Balance | |||||
| NSA | NSA | NSA | |||||
| 2012 | Jan | 1,119 | 1,904 | – 790 | |||
| Feb | 950 | 1,853 | – 900 | ||||
| Mar | 1,143 | 2,151 | – 1,010 | ||||
| Apr | 1,443 | 2,717 | – 1,270 | ||||
| May | 1,594 | 2,581 | – 990 | ||||
| Jun | 1,624 | 3,301 | – 1,680 | ||||
| Jul | 2,055 | 3,490 | – 1,440 | ||||
| Aug | 2,432 | 4,416 | – 1,980 | ||||
| Sep | 1,988 | 3,854 | – 1,870 | ||||
| Oct | 1,524 | 2,747 | – 1,220 | ||||
| Nov | 1,306 | 1,816 | – 510 | ||||
| Dec | 1,462 | 1,620 | – 160 | ||||
| – £ 13,820 | |||||||
| 2013 | Jan | 1,245 | 2,052 | – 810 | |||
| Feb | 1,046 | 1,826 | – 780 | ||||
| Mar | 1,300 | 2,142 | – 840 | ||||
| Apr | 1,677 | 2,819 | – 1,140 | ||||
| May | 1,723 | 3,013 | – 1,290 | ||||
| June | 1,894 | 3,479 | – 1,590 | ||||
| July | 2,550 | 3,549 | – 1,000 | ||||
| Aug | 2,433 | 4,970 | – 2,540 | ||||
| Sep | 2,179 | 3,981 | – 1,800 | ||||
| Oct | 1,967 | 2,960 | – 990 | ||||
| Nov | 1,520 | 1,973 | – 450 | ||||
| Dec | 1,725 | 1,746 | – 20 | ||||
| – £ 13,250 | |||||||
| 2014 | Jan | 1,405 | 2,323 | – 920 | |||
| Feb | 1,187 | 2,118 | – 930 | ||||
| Mar | 1,320 | 2,281 | – 960 | ||||
| Apr | 1,526 | 2,727 | – 1,200 | ||||
| May | 1,791 | 3,053 | – 1,260 | ||||
| June | 2,121 | 3,414 | – 1,290 | ||||
| July | 2,669 | 3,543 | – 870 | ||||
| Aug | 2,568 | 4,983 | – 2,420 | ||||
| Sept | 2,178 | 4,150 | – 1,970 | ||||
| Oct | 1,790 | 3,248 | – 1,460 | ||||
| Nov | 1,571 | 2,019 | – 450 | ||||
| Dec | 1,725 | 1,677 | 50 | ||||
| – £ 13,680 | |||||||
| 2015 | Jan† | 1,318 | 2,322 | – 1,000 | |||
| Feb | 1,022 | 2,028 | – 1,010 | ||||
| Mar | 1,376 | 2,496 | – 1,120 | ||||
| Apr¹ | 1,540 | 2,950 | – 1,410 | ||||
| May¹ | 1,930 | 3,310 | – 1,380 | ||||
| Latest three months | 4,850 | 8,760 | -3,910 | ||||
| % change from year earlier | 5 | 9 | 14 | ||||
| Year to date | 7,190 | 13,110 | -5,920 | ||||
| % change from year earlier | -1 | 5 | 12 | ||||
| Latest 12 months | 21,810 | 36,140 | -14,330 | ||||
| % change from year earlier | 1 | 3 | 5 | ||||
| Source: International Passenger Survey | |||||||
| 1 Estimate rounded to nearest 10000 | |||||||
| † point of earliest revision due to the most recent quarterly benchmarking. | |||||||
| NSA Not seasonally adjusted | |||||||
Tourism Deficit in 2012 – £13.8 billion (£13.7 billion in 2011)
During 2012, overseas residents made an estimated 31.1 million visits to the UK, this is 1% higher than in 2011. …. Earnings from visits to the UK in 2012 year to date were £18.7 billion, 4% higher than in 2011.
And
During 2012 year to date, UK residents made an estimated 56.6 million visits abroad, unchanged from 2011. … UK residents have spent £32.6 billion on visits abroad in 2012, an increase of 3% from 2011. [Taking £18.7 billion away from £32.6 billion comes to £13.9 billion, so approximately the same as the £13.8 billion].
Tourism Deficit for 2011 – £13.7 billion (£14.9 billion in 2010)
| Year | Total tourism deficit from spending during the trip, by all transport modes £ | Tourism deficit from spending during the trip by air passengers £ | Tourism deficit from purchase of air tickets | Total tourism deficit due to air passengers |
| £ billion | ||||
| 2005 | 17.9 | |||
| 2006 | 18.4 | |||
| 2007 | 19 | |||
| 2008 | 20.5 | 17.4 | 2.2 | 19.6 |
| 2009 | 15.1 | 13.2 | 2 | 15.3 |
| 2010 | 14.2 | £12.4 | 2.6 | 15 |
| 2011 | ? 13.1 | ? 11.2 |
Employment
See “Airport Jobs: false hopes, cruel hoax” (March 2009)
The aviation industry routinely claims it creates huge numbers of jobs for the UK economy. In practice, most low price airlines make every effort they can to reduce the number of employees (automatic check in, automatic baggage systems etc) and the number of jobs created per extra million passengers is not high, and has reduced over the years.
According to the OEF (Oxford Economic Forecasting – not part of Oxford University) report “The Economic Contribution of the Aviation Industry in the UK” (OEF) published in 2006, http://www.oef.com/Free/pdfs/Aviation2006Final.pdf the number of direct jobs in the aviation sector in 2004 was 186,000 (full time equivalents) at a time that there were 215m terminal passengers.
However, the same body (OEF) stated that 180,000 were directly employed by the industry in 1998 in their previous report (1999), a year in which 159m passengers were handled. From this it would seem that a 34% increase in passengers led to only a 3% increase in jobs. This is not a strong reason to believe that net jobs will increase if aviation expands further. (Details)
According to the ONS the aviation industry directly provided an average of 120,000 UK jobs in 2009, a third fewer than in 1998 despite a 37% increase in the number of passengers carried. By comparison – again using the ONS estimate – the UK tourism industry directly supports 1.7m jobs in the UK. (Details)
Using figures supplied by the Airport Operators Association, OEF found that the aviation industry directly employed 186,000 people (full time equivalents) in 2004.
Despite substantially pruning its labour force, British Airways had 1,157 employees for
every million passengers in the year ended 31 March 2010 whilst Ryanair had just 106
employees per million passengers.
British Airways and Ryanair are of course two very different types of airlines but this is nevertheless an indication of the way the industry has changed. And Ryanair now handles more than twice as many passengers as British Airways.
A report by Oxera, for the Airport Operators Association (AOA) in Nov 2009 said the aviation sector directly provided 141,000 jobs in 2009, and “234,000 if the supplier base is also taken into account.”
The number of terminal passengers at UK airports in 1998 was 158,810,000; 168,288,000 passengers in 1999; the number in 2004 was 214,926,000; and the number of passengers in 2009 was 218,126,000 (CAA airport data)
http://www.aoa.org.uk/next-government-must-support-uk-airports.htm
Economic Benefit
Business travel accounts for under a quarter of the UK air travel market and the
business sector is almost in balance. In 2010, foreign businesses made 4.9m business trips to the UK by air (spending £3.6bn) compared to 5.2m overseas business trips by air by UK business (spending £3.8bn).
Leisure travel dominates the UK air travel market with a 77% share. In 2010 overseas
non-business visits by UK residents outnumbered non-business visits to the UK by more
than two to one and the UK incurred a trade deficit of £14.3bn on international air travel. Comprising £0.2bn deficit on business visits, £12.2bn deficit on non-business visits and £1.9bn deficit on purchases of air tickets
Overseas leisure travel has an undoubted social value for UK residents and it benefits
the countries visited by providing them with foreign currency earnings, jobs and investment.
There are however certain adverse economic impacts for the UK, particularly in relation to
UK jobs and investment. More detailed research would be needed in order to reliably
quantify the economic and employment impacts but we can estimate that the employment
impact of the UK deficit on international air travel could be up to 430,000 UK jobs.
The largest air tourism imbalances are in the least affluent regions of the UK, for
example, the North of England has a ratio of 4.7 outward tourists for every overseas visitor.
As a result, these are the areas whose local economies and jobs’ markets would have most to gain if a better balance could be achieved between outward, inward and domestic tourism.
Oxera says the aviation sector is estimated to “directly contribute around £4.8 billion of revenue to the Exchequer in 2007/8
OEF said that on a conservative estimate, the industry contributed £3.6 billion to the Exchequer in 2004/05. http://www.oef.com/Free/pdfs/Aviation2006Final.pdf
(Details, from the SSE submission on Aviation, Jobs and the Economy, to the Scoping Document Consultation, Oct 2011)
Air Passenger Duty (APD)
In 2010/11 the exemption from fuel tax and VAT was worth more than £11 billion to the airlines. After deducting APD revenues, the net benefit is around £9 billion – equivalent to a subsidy to the airlines of about £360 per household. The 53% of the UK population who do not fly – mainly the less affluent – find themselves subsidising the aviation industry. (Details)
The rates of APD change on 1st April 2012, when the rates rise by around 8% – in line with inflation, taking into account the fact there was no rise in 2011.The tax take is likely to be around £2.5 billion, rather than £2 billion per year after the rise. That means the net benefit to the industry of its exemption from VAT and fuel duty will be around £8.5 billion, after April 2012.
The Treasury has reiterated that APD is not an environmental tax. It was instituted in order to – in a small way – compensate for the aviation industry’s non-payment of fuel duty and VAT.
APD distance bands APD £ per passenger from 1 April 2012
(old rates from 1.11.2010)
Miles from UK Reduced rate Standard rate *
(in lowest class of travel) (in other than lowest . class of travel)
Band A (0-2000) £13 (£12) £26 (£24)
Band B (2001-4000) £65 (£60) £130 (£120)
Band C (4001-6000) £81 (£75) £162 (£150)
Band D (over 6000) £92 (£85) £184 (£174)
* premium classes, business class, first class etc
Details on APD compared to the benefits gained by the aviation industry by not paying fuel duty and VAT:
(Details)
• Motorists pay 58p a litre duty on their fuel. Airlines pay nil.
• Motorists pay a further 22p VAT on their fuel. Airlines pay nil.
• Motorists pay 20% VAT to have their car serviced. Airlines pay nil.
• Motorists pay 20% VAT to buy their car. Airlines pay no tax on new aircraft.
So as they pay no duty and no VAT, there is Air Passenger Duty instead. This tax is charged at only £12 per passenger for any short haul flight (under 2,000 miles) departing from a UK airport. Not on return trips. £12 on a holiday trip to anywhere in Europe does not seem a lot. The price of one or two main course in a restaurant? or 3 or 4 cups of coffee?
Higher rates of APD apply to longer flights. The APD rates (Nov 2011 – slightly higher from April 2012, see above) are:
Distance to capital city from London Economy/Premium
Band A (less than 2000 m) £12/£24
Band B (2001m – 4000m) £60/£120
Band C (4001m – 6000m) £75/£150
Band D (6001m+) £85/£170
The Treasury says: APD is an excise duty which is charged on the carriage, from a UK airport, of chargeable passengers on chargeable aircraft. Details
Information on APD on Wikipedia, including old rates, at http://en.wikipedia.org/wiki/Air_Passenger_Duty
Government Aviation Policy
UK Air Passenger Demand and CO2 Forecasts – 2007, 2009 and 2011
UK commitment to not allowing its carbon emissions rise above the level in 2005 by 2050
December 2009 – Committee on Climate Change Report
abatement potential of different measures for reducing UK aviation CO2 emissions
out to 2050, can be found at
VAT and Fuel Duty – neither is charged on air travel
https://fullfact.org/factchecks/airline_industry_subsidies_green_taxes-3256
“Aviation is actually subsidised in this country to the tune of £10 billion every single year, because aviation doesn’t pay tax on fuel for example, it doesn’t pay VAT on its tickets.”
Caroline Lucas, Question Time, 19 January 2012
Full Fact said:
“Jan 2012: On Question Time Green Party Leader Caroline Lucas alleged that the aviation industry in the UK is being subsidised in the form of fuel tax and VAT exemptions by some £10 billion. What is the evidence for this figure?
Analysis
The claim appears in a Green Party report and briefing in 2003. Both documents cite a 2003 report entitled “The Hidden Cost of Flying” by Brendon Sewill, an environmental campaigner.
In the report, Mr Sewill calculates that implementing fuel tax at the same rate as private fuel tax would cost the aviation industry £5.7 billion, adding VAT to the cost of tickets would add £4.0 billion to the cost, and the abolition of duty free would cost £0.4 billion. Deducting the contribution that air passenger duty (APD, worth £0.9 billion, which would no longer be necessary) makes to the Treasury, he calculates that the eocnomy could potentially be missing out on a contribution of £9.2 billion per year.
In a later report in 2005, Mr Sewill notes that the 2003 Volterra report for BAAappeared to confirm his calculations. Volterra’s calculations appear below:
Since both reports were produced, the aviation industry has expanded significantly and VAT has risen to 20 per cent. Both could have had an impact upon the figures.
However, Volterra calculates the average cost of a ticket to be £136, with 182 million passengers according to the Civil Aviation Authority. At a VAT rate of 20 per cent added to the cost of the ticket and assuming the same number of passengers, this would raise £4.95 billion. Added to the older figure for fuel tax, this amounts to a tax exemption of £10.65 billion.
It is worth noting however that these analyses assume that the addition of new taxes to airline tickets would not have an impact upon the demand to fly. Whether or not this is the case in reality might depend upon the extent to which airlines passed on these new costs to the customers, however theInstitute for Fiscal Studies has noted in the past that changes to VAT do have an impact upon levels of cunsumer demand.
Problems
When we got in touch with Caroline Lucas’s office we were told that the £10 billion figure was a “Government figure” – although the link they provided us with was to a letter in the Guardian. This stated:
“The Treasury in 2008 estimated part of this tax subsidy received by aviation: “Were the UK to charge a fuel duty and VAT on tickets, this could result in revenues of around £10 bn [per year].””
However that the figure has been used by government is seemingly confirmed by a Department for Transport response to the 2007 consultation on the Aviation Emissions Cost Assessment.
The value of this estimate was however questioned by the Transport Committee in 2010, who noted that:
“it ought be relatively straightforward to provide a factual account. We asked for this, but did not receive one. It would be helpful if the Government clarified this issue with a statement of the revenues raised, the extent of any tax exemptions and how these compare to the social and environmental costs of aviation. As part of this clarification, the Government needs to explain the basis for its earlier statement that an additional £10 billion might be raised if VAT and fuel duty were applied to aviation.”
The Transport Committee report also highlights some difficulties associated with describing these examptions as subsidies (and indeed it notes that, unlike rail and bus travel, “airports and airlines receive virtually no subsidy.”). In fact these perks are better described as tax breaks (i.e. money that isn’t collected by HMRC, rather than public funds made available to the industry).
To complicate matters further, there are a number of historical and legal precedents for the aviation industry’s tax exemptions. For example, the 1947Convention on International Civil Aviation specifies that aeroplanes should be exempt from fuel duties, while in the UK all forms of passenger transport arezero-rated for VAT.
Conclusion
So while the £10 billion figure has been widely used – both in government and by others – to describe the savings that the aviation industry enjoys as a result of its VAT and fuel duty exemption, questions have been raised about the details.
Government itself hasn’t provided the specifics behind itsz use of the estimate, while the breakdowns we have seen from Volterra and Brendon Sewill are now slightly dated.
Update: 26 January 2012
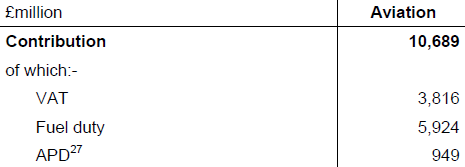
Brendon Sewill has been in touch with us to point out that the Treasury responded to the Select Committee’s request for more information. According to their response, the figure of £10 billion is rounded and calculated from a 2008 Office for National Statistics figure on the amount spent on air travel (£13 billion), combined with Department of Energy and Climate Change figures on air fuel consumption (16 billion litres of fuel). They give rounded figures for the potential tax of £2 billion (VAT) and £8.5 billion (fuel duty) respectively.
Full Fact has found updated DECC figures for fuel usage which state that during 2010, 11.2 million tonnes of fuel were used in the aviation industry. Jet A fuel has a density of roughly 0.82kg/l, suggesting that 13.62 billion litres were used. The figure is likely to be lower than in 2008 due to the effects of the economic downturn and improvements in aircraft efficiency. If fuel duty were applied in the same way as for unleaded petrol (currently 0.5795 £/litre, although due to be raised to 0.6097 £/litre in August) this would raise £7.89 billion.
The ONS has also released updated figures for consumer spending, showing that in 2010 £12.4 billion was spent on air travel. Applying the current VAT rate of 20 per cent, this would raise £2.48 billion. Added together, if VAT and fuel duty were applied to the aviation industry, this would raise £10.37 billion.
Further data for the financial year 2010/11 shows that £2.16 billion was raised by Air Passenger Duty, resulting in a net figure of £8.21 billion.”
More up to date figures on the amount raised by APD here.
Carbon offsetting for your flight – does it work?
An article in the Sunday Times reveals that offsetting schemes involving tree planting can take a century to remove the CO2 from the atmosphere, making them very ineffective as a meals of reducing the climate changing effect of emissions. Offsetting your carbon footprint takes decades
“Cheatneutral”
If you can’t make your mind up about offsetting, have a look at the Cheatneutral website. As it helpfully says: “What is Cheat Offsetting?
When you cheat on your partner you add to the heartbreak, pain and jealousy in the atmosphere. Cheatneutral offsets your cheating by funding someone else to be faithful and NOT cheat. This neutralises the pain and unhappy emotion and leaves you with a clear conscience.”
http://www.cheatneutral.com
The aviation industry’s advertising ………..
The industry is very good at telling part of the truth, and using adverts to put their message across. There are the BAA adverts showing maps of the world covered in the words Opportunities and Customers emblazoned across the whole world, showing Customers in large letters across Siberia and the Sahara. And many more. The airports are working hard to cut their ground emissions, installing wind turbines, recycing paper, cutting down on energy used for lighting etc. All very laudable and excellent. But at the same time aiming to increase flights by as much as possible, negating the savings made. So …sadly … greenwash. The ads by IATA below take some beating though.
IATA – mastery of greenwash – The IATA adverts
IATA (the International Air Transport Association) has produced a series of adverts, which appear in in-flight magazines and in other media. The aim is to tell people how green flying is, how the aviation industry is trying very hard to reduce emissions, and how flying really is wonderful. Their solutions to the carbon emissions problem range from reducing the number of ice cubes on board planes, blaming cows, flying in straight lines, to keeping the planes clean.
“But people love air travel, and we don’t want to stop the poor from flying !”
Surveys show most people would be prepared to pay more to fly for the sake of the environment
• ‘Choice’ can be deceptive. Often the real reason for ‘choosing’ the plane is because ‘everyone else does’, or because we’re unaware of alternatives.
• It would be physically impossible for the whole world to fly as much as the UK currently does. Yet climate change will hurt the part of the world whose people fly the least. There is a real question of justice here.
“Love Miles”
“I’m trying hard to be eco-friendly. But please don’t ask me to give up flying to visit my family”
24th April 2008. Tahmina Anam, a Pakistani living in Britain, says “there is no other way to live apart, no other way to make it OK that our lives happen in each other’s absence, than to allow ourselves the promise of regular visits.” (Guardian Comment)
Watch the YouTube video of air traffic over Europe
 loads slowly!
Watch the YouTube video of global air traffic


Flightmapping – shows which airports fly to which countries

Consultation by DfT on the Aviation Scoping Document
http://www2.dft.gov.uk/consultations/open/2011-09/consultationdocument.pdf