Around 800 million air passengers in the EU in 2010. UK had 193 million – which is 3.1 passengers per inhabitant
Data collected by the EU shows that in 2010, the UK reported the highest number of air passengers for any EU country, with almost 193 million or 3.1 passengers per inhabitant (which was approximately double the EU-27 average). Just under 800 million passengers were carried by air in 2010 in the EU-27. The number of air passengers carried in the EU-27 had stagnated in 2008, fell by -5.9 % in 2009, and rebounded by +6.0 % in 2010. There is data for the top 15 European airports.
EU Air passengers
London Heathrow was the busiest airport in the EU-27 in terms of passenger numbers in 2010 (65.7 million), followed by Paris’ Charles-de-Gaulle airport (58.0 million), and then Frankfurt airport, Madrid’s Barajas airport and Amsterdam’s Schiphol airport (all with between 52.6 million and 45.1 million passengers) – see Figure 2.
With the exception of Barajas, the overwhelming majority (at least 88 %) of passengers through the other four largest airports in the EU were on international flights. In contrast, national (domestic) flights accounted for 37.7 % of the passengers carried through Barajas in 2010. There were also relatively high proportions of passengers on national flights to and from Paris Orly (53.0 %), Barcelona airport (39.9 %) and Roma Fiumicino (35.2 %).
Just under 800 million passengers were carried by air in 2010 in the EU-27 (see Table). The number of air passengers carried in the EU-27 had stagnated in 2008, fell by 5.9 % in 2009, and rebounded by 6.0 % in 2010.
The United Kingdom reported the highest number of air passengers in 2010, with almost 193 million or 3.1 passengers per inhabitant (which was approximately double the EU-27 average). Relative to population size, the importance of air travel was particularly high for the popular holiday islands of Cyprus and Malta (8.7 and 7.9 passengers carried per inhabitant).
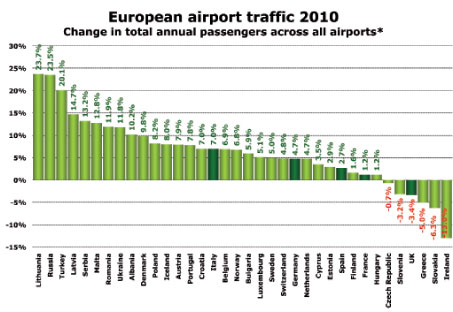
[Anna Aero says passenger numbers handled at Europe’s airports in 2010 grew by around +4.2%.]
http://epp.eurostat.ec.europa.eu/statistics_explained/index.php/Passenger_transport_statistics
Top 15 airports, passengers carried (embarked and disembarked), EU-27, 2010 (million passengers)

,_EU-27,_2010_(million_passengers).png&filetimestamp=20111117162346)
Air and sea passenger transport, 2009 and 2010

.png&filetimestamp=20111117161836)
Air passengers (eurostat data)
Air transport statistics concern national and international transport, as measured by the number of passengers carried; information is collected for arrivals and departures. Air passengers carried relate to all passengers on a particular flight (with one flight number) counted once only and not repeatedly on each individual stage of that flight. Air passengers include all revenue and non-revenue passengers whose journey begins or terminates at the reporting airport and transfer passengers joining or leaving the flight at the reporting airport; but excludes direct transit passengers. Air transport statistics are collected with a monthly, quarterly and annual frequency, although only the latter are presented in this article. There are also air transport passenger statistics on the number of commercial passenger flights made, as well as information relating to individual routes and the number of seats available. Annual data are available for most of the EU Member States from 2003 onwards
http://epp.eurostat.ec.europa.eu/statistics_explained/index.php/Passenger_transport_statistics
AnnaAero
Globally
Globally, IATA says there were around 2.74 billion global air passengers in 2006. And IATA says 2.5 billion passengers flew commercially in 2009. Of those, international passengers worldwide were 952 million and there were 1.5 billion domestic passengers globally in 2009. [Obtaining the figures is surprisingly hard…]
http://www.iata.org/pressroom/facts_figures/fact_sheets/pages/iata.aspx
ICAO data (passenger kilometres performed – not passenger numbers)
| Global and Regional Scheduled Passenger Traffic – 2011 to 2013 [passenger-kilometres performed (PKP)] |
| Region of airline registration | 2000 (PKP in billions) | 2010 | Average annual growth 2000-2010 (%) | FORECAST | ||
| 2011 (%) | 2012 (%) | 2013 (%) | ||||
| Africa | 66.4 | 123.1 | 6.4 | 5.4 | 8.0 | 8.3 |
| Asia/Pacific | 735.5 | 1,292.7 | 5.8 | 7.9 | 8.8 | 8.7 |
| Europe | 804.1 | 1,316.6 | 5.1 | 3.3 | 3.8 | 3.9 |
| Middle East | 98.8 | 345.3 | 13.9 | 14.4 | 14.0 | 13.5 |
| North America | 1,175.7 | 1,411.7 | 1.8 | 2.4 | 3.4 | 2.9 |
| Latin America/Caribbean | 141.8 | 197.6 | 3.4 | 6.9 | 7.3 | 6.8 |
| World | 3 017.3 | 4 687.0 | 4.5 | 5.3 | 6.2 | 6.1 |
http://legacy.icao.int/airtransport/eap/Eap_FP_Forecast_Tables.htm#
http://legacy.icao.int/airtransport/eap/Eap_FP_ForecastMed.htm
The World Bank has figures, country by country, of air passengers, However, these are very incomplete as though it contains both domestic and international aircraft passengers – they are only for air carriers registered in the country.
http://data.worldbank.org/indicator/IS.AIR.PSGR
The figures below, from Nation Master, also only include the passengers flying on airlines registered in the country. So figures for the UK are very much too low. However, they give a general impression of the extent of air travel activity per country.
Air transport, passengers carried by country in 2008
(just the top 20 shown)
| Rank | Countries  | Amount  | Date | |
|---|---|---|---|---|
| # 1 | 701,779,551 | 2008 | ||
| # 2 | 191,001,220 | 2008 | ||
| # 3 | 107,941,584 [191,000,000 in total approx] | 2008 | ||
| # 4 | 104,713,553 [235,360,000 in total approx] | 2008 | ||
| # 5 | 97,022,471 | 2008 | ||
| # 6 | 61,214,656 [134,800,000 in total approx] | 2008 | ||
| # 7 | 58,763,225 | 2008 | ||
| # 8 | 55,213,716 [203,800,000 in total approx] | 2008 | ||
| # 9 | 53,718,757 | 2008 | ||
| # 10 | 51,488,427 | 2008 | ||
| # 11 | 50,737,809 | 2006 | ||
| # 12 | 49,877,935 | 2008 | ||
| # 13 | 37,940,321 | 2008 | ||
| # 14 | 30,672,048 [133,500,000 in total approx] | 2008 | ||
| # 15 | 29,766,093 | 2008 | ||
| # 16 | 29,601,230 | 2008 | ||
| # 17 | 25,505,092 | 2008 | ||
| # 18 | 22,420,870 | 2008 | ||
| # 19 | 19,993,134 | 2008 | ||
| # 20 | 19,565,884 | 2006 |
http://www.nationmaster.com/graph/tra_air_tra_pas_car-transportation-air-transport-passengers-carried
and figures in [ ] brackets from detailed European data from Anna Aero at http://www.anna.aero/european-airport-traffic-trends/
SUMMARY: PRELIMINARY RESULTS FOR 2010, compared to 2009
Total Passengers: +6.3%
Total International Passengers: +7.5%
Total Cargo (includes mail): +15.2%
Total International Freight: +20.5%
Anna Aero Top 12 domestic markets globally
") Source: OAG Max Online for w/c 5 December 2011
Source: OAG Max Online for w/c 5 December 2011